Measure GitHub Copilot adoption and usage with plugins
GitHub Copilot AI Adoption and Usage is a custom Port plugin that turns raw GitHub Copilot organization metrics into an interactive engineering intelligence dashboard. It shows active users, acceptance rates, lines of code, PR activity, and (optionally) AI-generated insight reports about your GitHub Copilot usage.
Usage metrics tell you whether engineers are using GitHub Copilot, but not why adoption varies across teams or where productivity gains are landing. This plugin surfaces those signals in one place, from DAU/WAU/MAU trends to per-IDE and per-language breakdowns. The optional AI Insights tab generates a prioritized report of findings and recommended actions from your usage data, and you can use Port's build with AI to act on them directly in your platform.
GitHub Copilot AI Adoption and Usage is a custom plugin, a Port feature for embedding your own React-based widgets. The source is maintained in the port-experimental/port-plugins repository; see the repository for the code and its disclaimer.
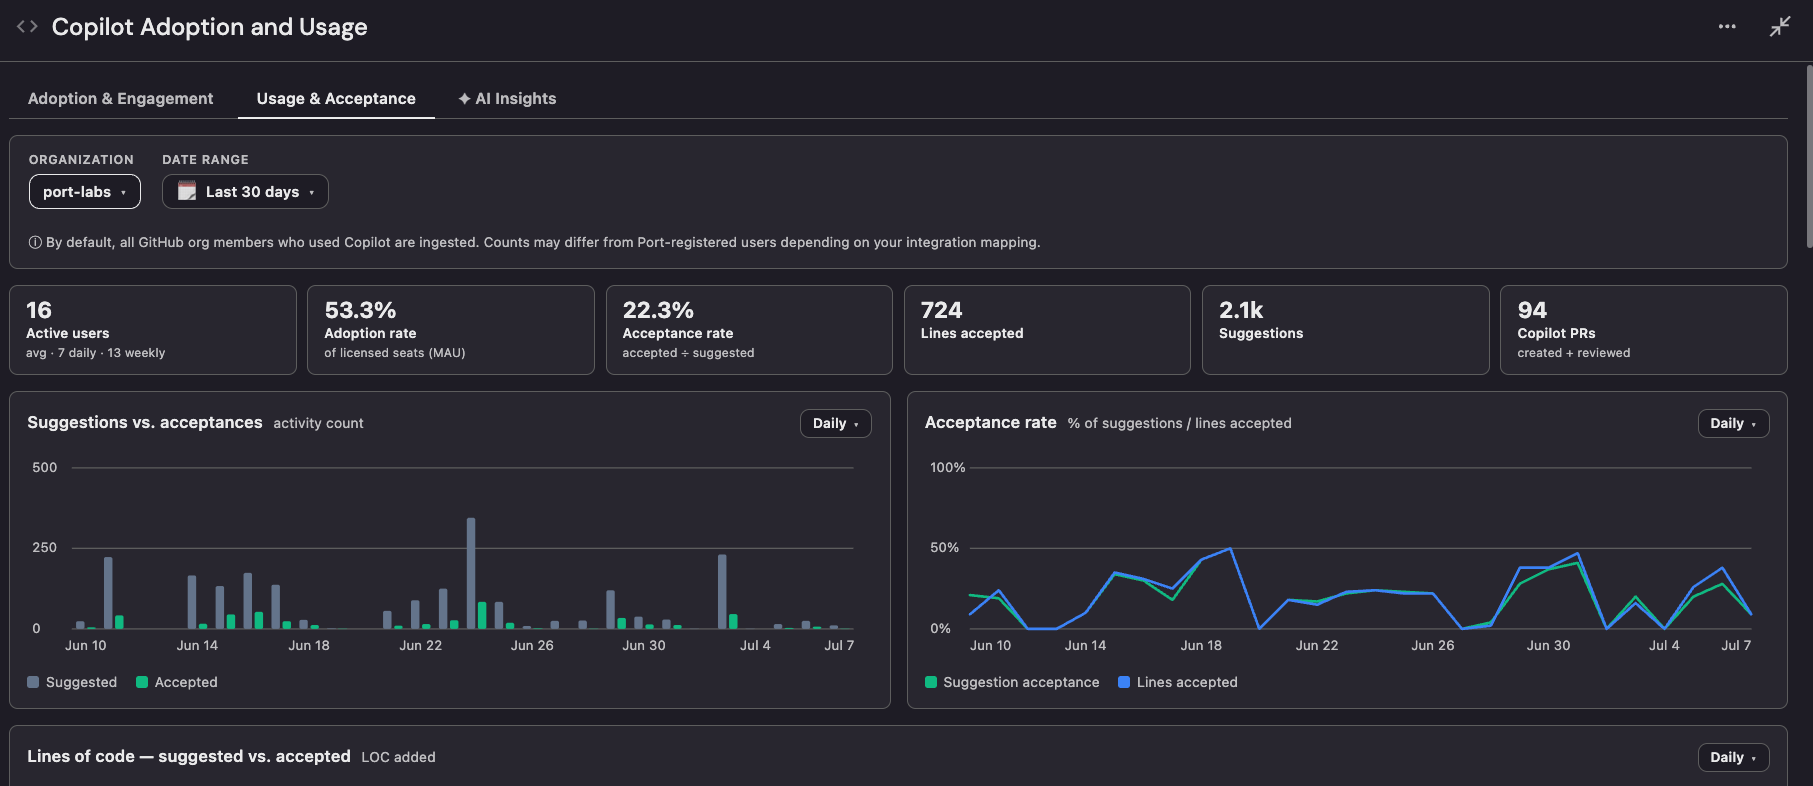
GitHub Copilot AI Adoption and Usage: KPI strip, filter bar, and adoption trend charts.
Overview
The plugin is organized into tabs that share a common filter bar and KPI strip.
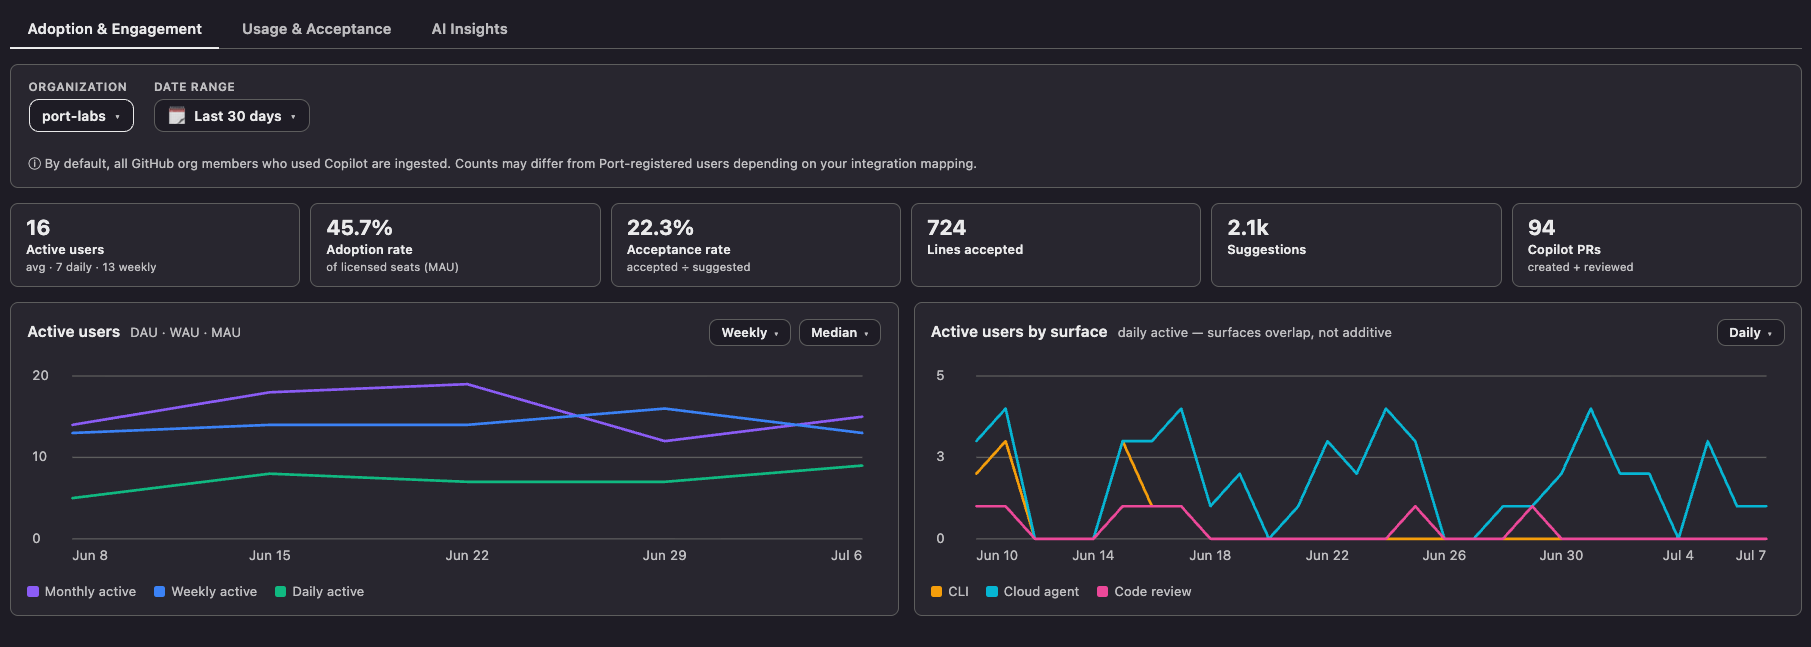
- Adoption & Engagement: active users (DAU/WAU/MAU) and active users by surface.
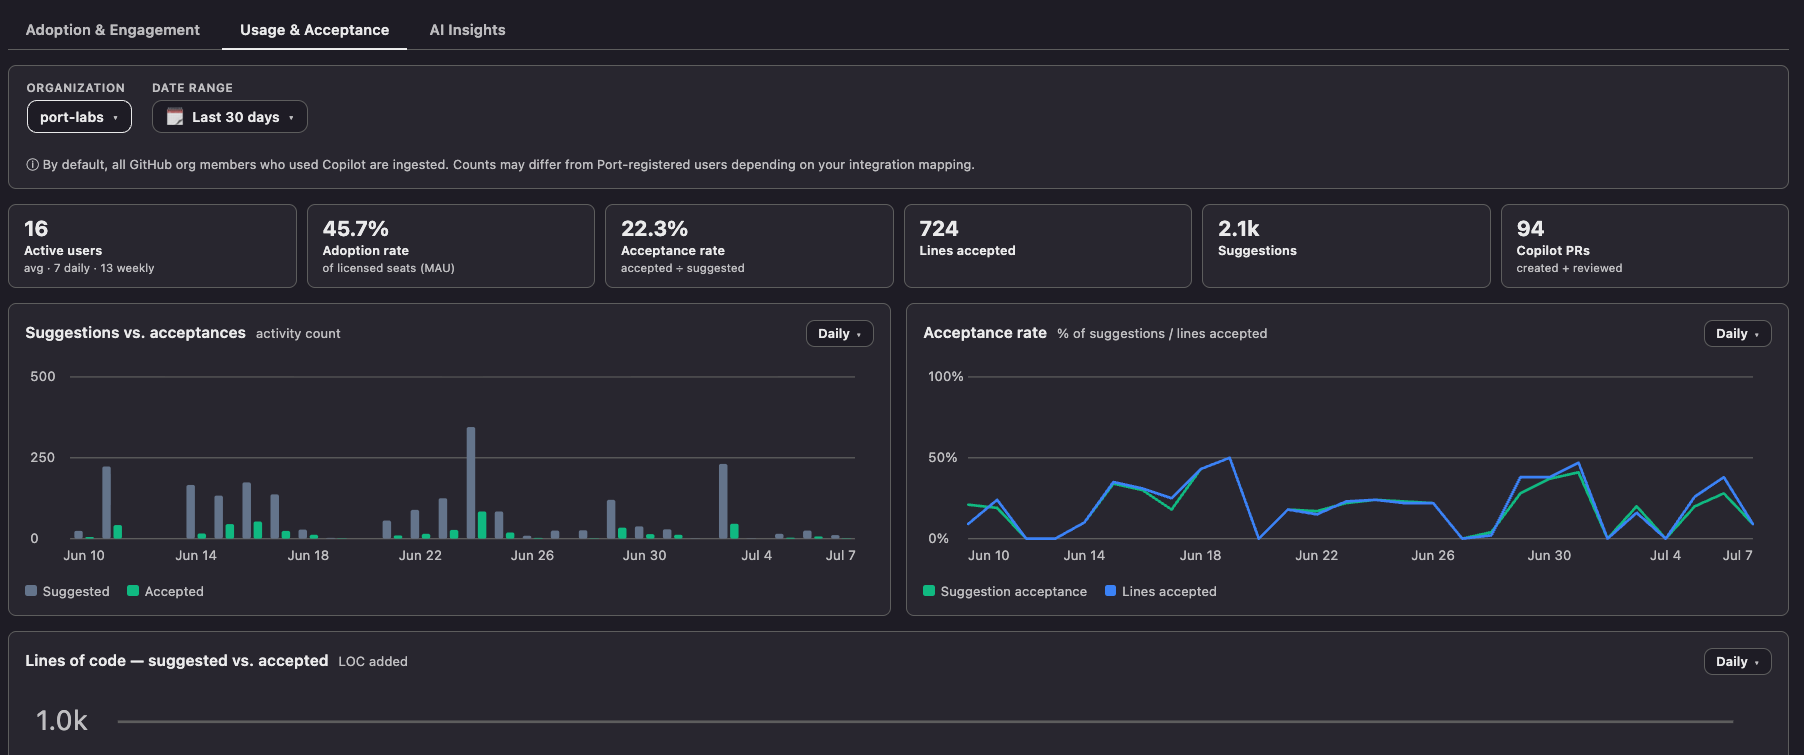
- Usage & Acceptance: code suggestions vs. acceptances, acceptance-rate trend, lines suggested vs. accepted, and a breakdown by IDE, feature, language, and model.
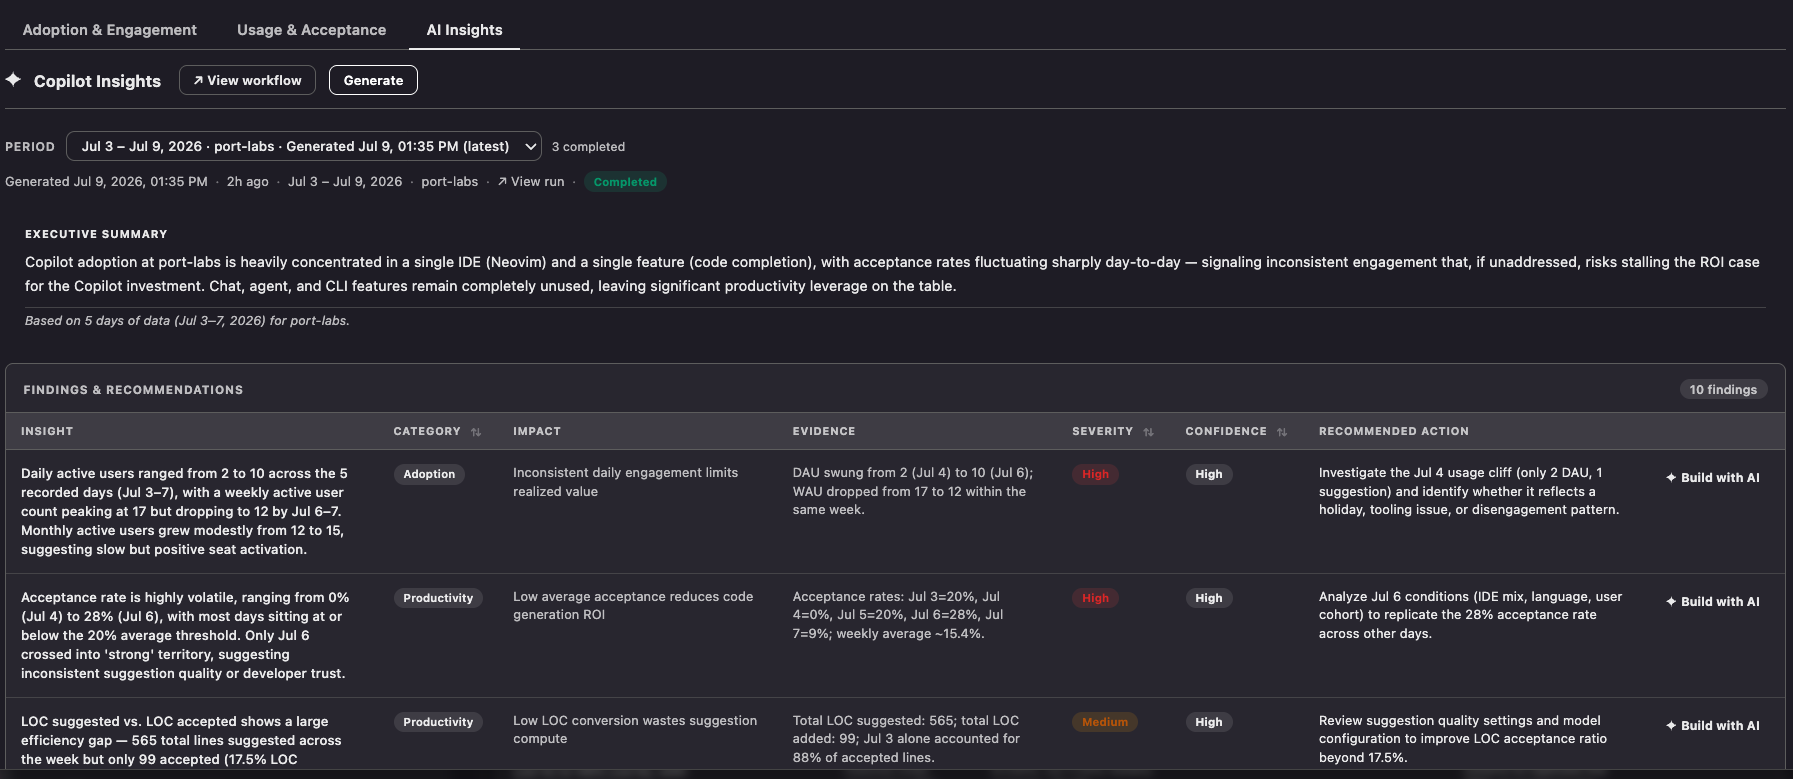
- AI Insights (optional): AI-generated insight reports about your GitHub Copilot usage: findings, risk signals, and recommended actions, generated on demand from your usage data via a Port workflow.
Common use cases
- Track DAU, WAU, and MAU trends across your GitHub Copilot organization and spot declining engagement early.
- Break down active users by surface (IDE, CLI, Cloud agent, Code review) to see where GitHub Copilot is being used and where it is not.
- Compare acceptance rates by language or IDE to find where GitHub Copilot delivers the most value and where engineers are ignoring suggestions.
- Monitor lines of code suggested vs. accepted to understand how much GitHub Copilot output engineers actually keep.
- Generate an AI insight report over any date window and use Port's build with AI to act on the findings directly in your platform.
What each tab offers
Adoption & Engagement
- Daily, weekly, and monthly active user counts with a compare overlay for the previous period.
- Active users by surface (IDE, CLI, code review, Copilot agent).
Usage & Acceptance
- Code suggestions vs. acceptances over the selected window.
- Acceptance-rate trend line, with optional comparison to the previous period.
- Lines suggested vs. lines accepted over time.
- Ranked breakdown by IDE, feature, language, or model; pick any combination from the filter bar.
AI Insights (optional, requires configuration)
- A list of AI-generated insight reports for the selected GitHub Copilot organization.
- Each report shows a summary, findings (with category, severity, confidence, impact, evidence, and recommended action), and risk signals.
- A Generate button kicks off a Port workflow that queries your usage data and calls an AI model, then writes the result back so the tab updates automatically.
By default, all GitHub Copilot organization members who used Copilot are ingested. Counts may differ from Port-registered users depending on your integration mapping.
Prerequisites
- Admin permissions in your Port organization (you will add a dashboard widget and optionally create a blueprint).
- The plugin uploaded to your organization. See Upload the plugin below.
- The native GitHub Copilot integration installed and configured with the full mapping. See Step 1 below.
- (Optional) A
github_copilot_insightsblueprint and a Port workflow for the AI Insights tab. See Step 2 below.
Upload the plugin
The plugin source lives in the port-experimental/port-plugins repository. Clone it, then build and upload the plugin with the Port plugins CLI. Run the upload from the plugin's directory, after building it:
# Build the plugin (produces dist/index.html)
npm run build

# Upload (or update) the plugin in your organization
npx @port-labs/port-plugins-cli upload --upsert \
  --identifier ai-usage-github-copilot \
  --title "Github Copilot AI Adoption and Usage" \
  --file dist/index.html \
  --params "$(cat upload-params.json)"
| Plugin | Directory | Identifier | Title |
|---|---|---|---|
| GitHub Copilot AI Adoption and Usage | engineering-intelligence-ai-usage-copilot | ai-usage-github-copilot | Github Copilot AI Adoption and Usage |
After uploading, verify the plugin exists with npx @port-labs/port-plugins-cli list, or open the Plugins Manager in your portal (Builder in the top bar, then Plugins Manager in the left sidebar).
Step 1: Configure the integration mapping
Port's native GitHub Copilot integration creates the githubCopilotOrganizationUsage blueprint and populates it automatically. The default mapping includes a basic set of properties; the plugin also needs breakdown arrays, code-review user counts, and PR totals that may not be present yet. For each missing property, you need to add it to both the blueprint schema and the integration mapping.
Follow these steps to update your mapping:
- Go to your Builder page, open the GitHub Copilot Organization Usage blueprint, and add any missing properties from the block below to its schema.
- Go to your Data Sources page, click on the GitHub Copilot integration, and open the Mapping tab.
- Find the existing
organization-usage-metricsresource. Add the corresponding mapping lines for any properties you just added to the blueprint; leave all other resources and properties untouched.
If your mapping is still the default (unchanged), you can paste the full resource block below as-is. If you have customized it, merge only the missing properties into your existing resource rather than replacing it.
Integration mapping for organization-usage-metrics (click to expand)
- kind: organization-usage-metrics
  selector:
    query: 'true'
  port:
    entity:
      mappings:
        identifier: (.__organization.login + "@" + .day)
        blueprint: '"githubCopilotOrganizationUsage"'
        title: (.__organization.login + " copilot-metrics " + .day)
        properties:
          record_date: .day + "T00:00:00Z"
          daily_active_users: .daily_active_users
          weekly_active_users: .weekly_active_users
          monthly_active_users: .monthly_active_users
          monthly_active_chat_users: .monthly_active_chat_users
          monthly_active_agent_users: .monthly_active_agent_users
          daily_active_cli_users: .daily_active_cli_users
          daily_active_copilot_cloud_agent_users: .daily_active_copilot_cloud_agent_users
          weekly_active_copilot_cloud_agent_users: .weekly_active_copilot_cloud_agent_users
          monthly_active_copilot_cloud_agent_users: .monthly_active_copilot_cloud_agent_users
          daily_active_copilot_code_review_users: .daily_active_copilot_code_review_users
          weekly_active_copilot_code_review_users: .weekly_active_copilot_code_review_users
          monthly_active_copilot_code_review_users: .monthly_active_copilot_code_review_users
          daily_passive_copilot_code_review_users: .daily_passive_copilot_code_review_users
          weekly_passive_copilot_code_review_users: .weekly_passive_copilot_code_review_users
          monthly_passive_copilot_code_review_users: .monthly_passive_copilot_code_review_users
          user_initiated_interaction_count: .user_initiated_interaction_count
          code_generation_activity_count: .code_generation_activity_count
          code_acceptance_activity_count: .code_acceptance_activity_count
          loc_suggested_to_add_sum: .loc_suggested_to_add_sum
          loc_added_sum: .loc_added_sum
          loc_suggested_to_delete_sum: .loc_suggested_to_delete_sum
          loc_deleted_sum: .loc_deleted_sum
          prs_created_by_copilot: .pull_requests.total_created_by_copilot
          prs_reviewed_by_copilot: .pull_requests.total_reviewed_by_copilot
          prs_merged_by_copilot: .pull_requests.total_merged_created_by_copilot
          total_copilot_applied_suggestions: .pull_requests.total_copilot_applied_suggestions
          git_hub_org: .__organization.login
          totals_by_ide: .totals_by_ide
          totals_by_feature: .totals_by_feature
          totals_by_language_feature: .totals_by_language_feature
          totals_by_language_model: .totals_by_language_model
          totals_by_model_feature: .totals_by_model_feature
          totals_by_ai_adoption_phase: .totals_by_ai_adoption_phase
          pull_requests: .pull_requests
          totals_by_cli: .totals_by_cli
Step 2 (optional): Set up the AI Insights tab
Skip this step if you only need the adoption and usage charts.
The AI Insights tab requires two additional resources:
- A blueprint (
github_copilot_insights) that stores one entity per generated insight report. - A Port workflow that queries your usage data, calls an AI model, and writes the result to that blueprint.
Create the insights blueprint
Github Copilot Insights blueprint (click to expand)
{
  "identifier": "github_copilot_insights",
  "title": "Github Copilot Insights",
  "icon": "Brain",
  "schema": {
    "properties": {
      "period": {
        "title": "Period",
        "description": "Human-readable period label, e.g. Jun 1–30 2025",
        "type": "string"
      },
      "generated_at": {
        "title": "Generated At",
        "description": "When this insight was generated",
        "type": "string",
        "format": "date-time"
      },
      "summary": {
        "title": "Summary",
        "description": "Executive summary of Copilot adoption for the period",
        "type": "string",
        "format": "markdown"
      },
      "key_findings": {
        "title": "Key Findings",
        "description": "3–5 notable observations from the data",
        "type": "array"
      },
      "recommendations": {
        "title": "Recommendations",
        "description": "Actionable next steps to improve Copilot adoption",
        "type": "array"
      },
      "risk_signals": {
        "title": "Risk Signals",
        "description": "Warning signals that may require attention",
        "type": "array"
      },
      "trend_direction": {
        "title": "Trend Direction",
        "description": "Overall adoption trend for the period",
        "type": "string",
        "enum": ["improving", "stable", "declining"],
        "enumColors": { "improving": "green", "stable": "blue", "declining": "red" }
      },
      "confidence_note": {
        "title": "Confidence Note",
        "description": "E.g. based on 30 days of data",
        "type": "string"
      },
      "raw_response": {
        "title": "Raw Response",
        "description": "Full JSON response from the AI model (used by the plugin for structured rendering).",
        "type": "string"
      },
      "run_id": {
        "title": "Workflow Run ID",
        "type": "string"
      },
      "org": {
        "title": "GitHub Org",
        "description": "GitHub org this insight was generated for, or empty for all orgs",
        "type": "string"
      }
    },
    "required": []
  },
  "calculationProperties": {},
  "relations": {}
}
Create the insights workflow
- Go to your Workflows page and click + Workflow.
- Click the See workflow JSON button (the
</>icon in the top bar). - Replace the default JSON with the block below and click Save.
Github Copilot Insights workflow JSON (click to expand)
{
  "title": "Generate Github Copilot Insights",
  "icon": "Brain",
  "allowAnyoneToViewRuns": true,
  "connections": [
    {"sourceIdentifier": "trigger", "targetIdentifier": "analyze_metrics"},
    {"sourceIdentifier": "analyze_metrics", "targetIdentifier": "save_insight"}
  ],
  "nodes": [
    {
      "identifier": "trigger",
      "title": "Generate Github Copilot Insights",
      "config": {
        "type": "SELF_SERVE_TRIGGER",
        "userInputs": {
          "properties": {
            "period_from": {"title": "Period From", "type": "string"},
            "period_to": {"title": "Period To", "type": "string"},
            "metrics_blueprint": {"title": "Metrics Blueprint Identifier", "type": "string"},
            "org_filter": {"title": "GitHub Org (leave blank for all)", "type": "string"}
          },
          "required": ["period_from", "period_to", "metrics_blueprint"],
          "order": ["period_from", "period_to", "metrics_blueprint", "org_filter"]
        },
        "executeActionButtonText": "Generate",
        "published": true,
        "permissions": {"roles": ["Admin", "Member"]}
      }
    },
    {
      "identifier": "analyze_metrics",
      "title": "AI Analysis",
      "icon": "Brain",
      "config": {
        "type": "AI",
        "userPrompt": "Analyze GitHub Copilot usage for the period from {{ .outputs.trigger.period_from }} to {{ .outputs.trigger.period_to }}.\n\nSearch for entities in blueprint \"{{ .outputs.trigger.metrics_blueprint }}\" where the `record_date` property is between {{ .outputs.trigger.period_from }} and {{ .outputs.trigger.period_to }}.{{ if .outputs.trigger.org_filter }} Filter entities to only those where `git_hub_org` equals \"{{ .outputs.trigger.org_filter }}\".{{ end }} Analyze only those entities.\n\nFor the matching entities retrieve and analyze: daily_active_users, weekly_active_users, monthly_active_users, code_generation_activity_count, code_acceptance_activity_count, loc_suggested_to_add_sum, loc_added_sum, pull request totals, totals_by_ide, totals_by_language_feature, totals_by_ai_adoption_phase.\n\nReturn the structured JSON response.",
        "systemPrompt": "You are an expert GitHub Copilot adoption analyst producing structured insights for engineering leaders.\n\nWhen searching for entities, always filter by the `record_date` property to match only the requested date range. Only analyze entities whose `record_date` value falls within the requested period - do not include data from outside that range. When an org_filter is provided, additionally filter to only entities where `git_hub_org` matches that value exactly.\n\nGenerate EXACTLY 10 findings and EXACTLY 3 risk signals - no more, no fewer.\n\nFor the summary field:\n- MAXIMUM 2 sentences.\n- Write for a VP of Engineering reading in 30 seconds.\n- Lead with the single most important trend or signal, then its business implication.\n- Do NOT list raw numbers or enumerate metrics. Speak in direction and trend only.\n\nFor the confidence_note field:\n- ONE short sentence only.\n- State the data basis simply, e.g. \"Based on 7 days of data for port-labs.\"\n- Do NOT mention field names, API properties, data quality analysis, or technical details.\n\nFor each finding, ALL fields must be concise:\n- insight: max 2 sentences\n- category: one of: Adoption, Productivity, Cost, Quality, Security\n- impact: one short phrase (5-10 words max)\n- evidence: one sentence with specific numbers\n- severity: exactly \"High\" | \"Medium\" | \"Low\"\n- confidence: exactly \"High\" | \"Medium\" | \"Low\"\n- recommended_action: max 1 sentence\n\nFor risk_signals: exactly 3 strings, each max 1 sentence.\n\nSeverity guide: High = urgent / significant business impact. Medium = worth addressing. Low = minor optimization.\nAcceptance rates: <20% low, 20-35% average, >35% strong.",
        "tools": [".*"],
        "outputSchema": {
          "type": "object",
          "properties": {
            "summary": {"type": "string"},
            "findings": {
              "type": "array",
              "items": {
                "type": "object",
                "properties": {
                  "insight": {"type": "string"},
                  "category": {"type": "string"},
                  "impact": {"type": "string"},
                  "evidence": {"type": "string"},
                  "severity": {"type": "string"},
                  "confidence": {"type": "string"},
                  "recommended_action": {"type": "string"}
                }
              },
              "minItems": 10,
              "maxItems": 10
            },
            "risk_signals": {
              "type": "array",
              "items": {"type": "string"},
              "minItems": 3,
              "maxItems": 3
            },
            "confidence_note": {"type": "string"}
          },
          "required": ["summary", "findings", "risk_signals", "confidence_note"]
        }
      }
    },
    {
      "identifier": "save_insight",
      "title": "Save to github_copilot_insights",
      "icon": "Brain",
      "config": {
        "type": "UPSERT_ENTITY",
        "blueprintIdentifier": "github_copilot_insights",
        "mapping": {
          "identifier": "{{ .run.identifier }}",
          "title": "Copilot Insights {{ .outputs.trigger.org_filter }} {{ .outputs.trigger.period_from }} to {{ .outputs.trigger.period_to }}",
          "properties": {
            "org": "{{ .outputs.trigger.org_filter }}",
            "period": "{{ .outputs.trigger.period_from }} to {{ .outputs.trigger.period_to }}",
            "run_id": "{{ .run.identifier }}",
            "generated_at": "{{ now | todateiso8601 }}",
            "raw_response": "{{ .outputs.analyze_metrics.response }}"
          }
        },
        "onFailure": "terminate"
      }
    }
  ]
}
Step 3: Add the plugin widget
With the blueprint created and the plugin uploaded, add the widget to a dashboard.
- Open a dashboard, click
+ Widget, and choose Custom (then select the plugin). - Fill in the fields:
| Field | Input | Description |
|---|---|---|
| GitHub Copilot Org Usage blueprint (required) | Github Copilot Org Usage | Blueprint holding the daily organization usage-metrics entities |
| Licensed seats | Number | Licensed GitHub Copilot seats. When set, enables the Adoption rate KPI (MAU ÷ seats) |
| Github Copilot Insights workflow identifier | generate_github_copilot_insights | Identifier of the workflow that generates insights. Required to enable the Generate button in the AI Insights tab |
| Github Copilot Insights blueprint | Github Copilot Insights | Required to enable the AI Insights tab |
Use the dashboard
Adoption & Engagement
Open the Adoption & Engagement tab and set the date range to the window you want to analyze. Use the Granularity control to switch between daily, weekly, and monthly rollup.
Usage & Acceptance
Open the Usage & Acceptance tab. Use the Breakdown selector to pivot between IDE, feature, language, and model. Ranking by acceptance rate surfaces the contexts where GitHub Copilot is most (or least) effective.
AI Insights
Open the AI Insights tab. Select the date range you want to analyze, then click Generate. The widget sends the range and your Copilot org usage blueprint identifier to the configured workflow, which queries your usage data and returns a structured insight report. The tab refreshes automatically when the report is ready.
Each insight report shows:
- A summary paragraph with the headline finding.
- A list of findings with category (e.g. Adoption, Usage, PRs), severity, confidence, impact, evidence, and a recommended action.
- Risk signals: short flags for concerning patterns in the data.
- A confidence note describing the data window the insights are based on.
Next steps
Pair GitHub Copilot usage data with other Engineering Intelligence signals for a complete picture:
- Survey Intelligence: gather self-reported AI adoption sentiment alongside the telemetry-based signals here.
- Delivery performance: PR cycle time and stale PRs. See whether higher GitHub Copilot acceptance correlates with faster delivery.
- Standards and scorecards: ownership, documentation, and on-call rotation.