Ingest LinearB metrics into Port
If you're currently using LinearB, this guide shows how to migrate those metrics into Port using the Ocean Custom Integration framework so you can consolidate on a single platform. Once ingested, you can compare LinearB data against Port's native metrics, validate parity, and transition to Port as your single source of truth for engineering performance. From there, apply scorecards, trigger automations, and use AI agents to uncover insights across your entire engineering organization.
Port is an Agentic Engineering Platform with native Engineering Intelligence it tracks DORA metrics, delivery health, developer productivity, AI tool adoption, and more, all tied to the services, teams, and infrastructure in your catalog. Rather than stopping at dashboards, Port drives an end-to-end feedback loop: measure, act, and verify impact through scorecards, agentic workflows, automations, and AI-driven recommendations. See Why Port for Engineering Intelligence to learn more.
Common use cases
- Transition from LinearB to a unified Agentic Engineering Platform that includes Engineering Intelligence.
- Run LinearB and Port side by side to validate metric parity before fully migrating.
- Leverage Port AI agents to surface patterns, bottlenecks, and recommendations from your engineering data.
- Define scorecards on ingested data to enforce quality standards and track adherence over time.
- Set up Port workflows and automations that react to metric changes (e.g. notify when cycle time spikes or deployment frequency drops).
Supported metrics
The integration ingests the following metrics from LinearB's Measurements V2 API:
DORA metrics (organization-level):
releases.count— number of deployments, used to compute deployment frequency.pm.mttr— mean time to recovery in minutes.pm.cfr.issues.done— incidents that reached a done state (change failure rate).
Pull request metrics (team-level):
branch.computed.cycle_time— full PR cycle time (coding + pickup + review + deploy).branch.time_to_review— pickup time before first review.branch.review_time— time spent in review.branch.time_to_prod— time from merge to production.branch.time_to_pr— coding time before PR is opened.pr.merged— count of merged PRs.branch.state.active— number of active branches (PRs in progress).commit.activity_days— days with developer activity.
The Measurements V2 API is available on LinearB Business and Enterprise plans. Free trials may not include API access. If you're evaluating LinearB, sign up for a trial and confirm API availability with their team.
Prerequisites
To use this integration, you need:
- A Port account with the onboarding process completed.
- A LinearB account on a Business or Enterprise plan.
- A LinearB API token generated from Company Settings > API Tokens in the LinearB UI. Learn more.
Installation
This integration was created using the custom Ocean integration framework.
Please note that:
- This integration will not be listed in the
Data sourcespage of your Port application, and must be installed manually using the instructions on this page. - This integration will not create components (e.g.
blueprints,mapping, etc.) in your portal automatically, you will need to create them manually using the instructions on this page.
The Ocean custom integration can be installed in two ways:
- Hosted by Port — Port manages the infrastructure; configure the connection in the Port UI.
- Self-hosted — Run the integration in your own infrastructure using Helm or Docker.
Choose one of the following options:
- Hosted by Port
- Helm
- Docker
This is the simplest method — Port hosts and manages the integration for you.
-
Go to your Data sources page.
-
Click
+ Data source. -
Select the Custom Integration option.
-
Fill in the following connection settings:
Setting Value Base URL https://public-api.linearb.ioAuth Type api_keyAPI Key Your LinearB API token Identifier my-ocean-linearb-integration -
Click Save & Continue.
Prerequisites
-
A Kubernetes cluster - the integration's container chart will be deployed to this cluster.
-
kubectlandhelmmust be installed on your machine. YourkubectlCLI must be connected to the Kubernetes cluster where you plan to install the integration.
Installation
- Add Port's Helm repo and install the Ocean Custom Integration:
Remember to replace the placeholders for YOUR_PORT_CLIENT_ID, YOUR_PORT_CLIENT_SECRET, and YOUR_LINEARB_API_TOKEN.
helm repo add --force-update port-labs https://port-labs.github.io/helm-charts
helm upgrade --install my-ocean-linearb-integration port-labs/port-ocean \
  --set port.clientId="YOUR_PORT_CLIENT_ID" \
  --set port.clientSecret="YOUR_PORT_CLIENT_SECRET" \
  --set port.baseUrl="https://api.port.io" \
  --set initializePortResources=true \
  --set scheduledResyncInterval=120 \
  --set integration.identifier="my-ocean-linearb-integration" \
  --set integration.type="custom" \
  --set integration.eventListener.type="POLLING" \
  --set integration.config.baseUrl="https://public-api.linearb.io" \
  --set integration.config.authType="api_key" \
  --set integration.config.paginationType="none" \
  --set integration.secrets.apiKey="YOUR_LINEARB_API_TOKEN"
The port_region, port.baseUrl, portBaseUrl, port_base_url and OCEAN__PORT__BASE_URL parameters select which Port API instance to use:
- EU (app.port.io) →
https://api.port.io - US (app.us.port.io) →
https://api.us.port.io
For advanced configuration such as proxies or self-signed certificates, click here.
To run the integration using Docker for a one-time sync:
Remember to replace the placeholders for YOUR_PORT_CLIENT_ID, YOUR_PORT_CLIENT_SECRET, and YOUR_LINEARB_API_TOKEN.
docker run -i --rm --platform=linux/amd64 \
  -e OCEAN__EVENT_LISTENER='{"type":"ONCE"}' \
  -e OCEAN__INITIALIZE_PORT_RESOURCES=true \
  -e OCEAN__SEND_RAW_DATA_EXAMPLES=true \
  -e OCEAN__INTEGRATION__CONFIG__BASE_URL="https://public-api.linearb.io" \
  -e OCEAN__INTEGRATION__CONFIG__AUTH_TYPE="api_key" \
  -e OCEAN__INTEGRATION__CONFIG__PAGINATION_TYPE="none" \
  -e OCEAN__INTEGRATION__SECRETS__API_KEY="YOUR_LINEARB_API_TOKEN" \
  -e OCEAN__PORT__CLIENT_ID="YOUR_PORT_CLIENT_ID" \
  -e OCEAN__PORT__CLIENT_SECRET="YOUR_PORT_CLIENT_SECRET" \
  -e OCEAN__PORT__BASE_URL="https://api.port.io" \
  ghcr.io/port-labs/port-ocean-custom:latest
The port_region, port.baseUrl, portBaseUrl, port_base_url and OCEAN__PORT__BASE_URL parameters select which Port API instance to use:
- EU (app.port.io) →
https://api.port.io - US (app.us.port.io) →
https://api.us.port.io
For advanced configuration such as proxies or self-signed certificates, click here.
Set up data model
Port's open data model lets you shape blueprints to match your needs. This guide uses a single engineering_metric blueprint that stores metrics from LinearB and any other analytics source. Every metric is tagged with source and category, so you can add providers like Swarmia or GetDX later without restructuring your model.
If you've already created this blueprint, just add linearb to the source enum. If this is your first time setting up external metrics, create the blueprint as shown below.
-
Go to the Builder page of your portal.
-
Click on
+ Blueprint. -
Click on the
{...}button in the top right corner, and chooseEdit JSON. -
Add this JSON schema and click
Save:Engineering metric blueprint (click to expand)
{"identifier": "engineering_metric","description": "A time-windowed snapshot of engineering performance metrics. Source-tagged to enable multi-provider ingestion and data parity validation.","title": "Engineering Metric","icon": "Analytics","schema": {"properties": {"source": {"type": "string","title": "Source","description": "The tool this metric was ingested from","enum": ["swarmia", "linearb"],"enumColors": {"swarmia": "blue","linearb": "turquoise"}},"category": {"type": "string","title": "Category","description": "The metric category","enum": ["dora", "pull_request"],"enumColors": {"dora": "purple","pull_request": "green"}},"window": {"type": "string","title": "Window","description": "The time window this snapshot covers","enum": ["7d", "30d"]},"start_date": {"type": "string","format": "date-time","title": "Start date"},"end_date": {"type": "string","format": "date-time","title": "End date"},"team_name": {"type": "string","title": "Team name","description": "Raw team name from the source system, used to match Port teams"},"deployment_frequency": {"type": "number","title": "Deployment frequency (per day)"},"change_lead_time_minutes": {"type": "number","title": "Change lead time (minutes)"},"change_failure_rate": {"type": "number","title": "Change failure rate (%)"},"mttr_minutes": {"type": "number","title": "Mean time to recovery (minutes)"},"deployment_count": {"type": "number","title": "Deployment count"},"cycle_time_seconds": {"type": "number","title": "Cycle time (seconds)"},"review_rate": {"type": "number","title": "Review rate (%)"},"time_to_first_review_seconds": {"type": "number","title": "Time to first review (seconds)"},"prs_merged_per_week": {"type": "number","title": "PRs merged per week"},"merge_time_seconds": {"type": "number","title": "Merge time (seconds)"},"prs_in_progress": {"type": "number","title": "PRs in progress"},"contributors": {"type": "number","title": "Contributors"},"review_time_seconds": {"type": "number","title": "Review time (seconds)"}},"required": ["source", "category", "window", "end_date"]},"mirrorProperties": {"team_identifier": {"title": "Team identifier","path": "team.$identifier"}},"calculationProperties": {"cycle_time_hours": {"title": "Cycle time (hours)","calculation": "if .properties.cycle_time_seconds then (.properties.cycle_time_seconds / 3600) else null end","type": "number"}},"aggregationProperties": {},"relations": {"team": {"title": "Team","target": "_team","required": false,"many": false}}}
Configuration
After installation, define which endpoints to sync in your integration configuration. Each resource maps an API endpoint to Port entities using JQ expressions to transform the data.
Key mapping components:
kind: The API endpoint path (combined with your base URL).selector.method: HTTP method (POSTfor LinearB's Measurements V2 API).selector.body: JQ expression evaluated to produce the JSON request body.selector.data_path: JQ expression pointing to the array of items in the response.port.entity.mappings: How to map API fields to Port entity properties.
For more details on how the Ocean Custom Integration works, see the overview.
LinearB returns time-based metrics in minutes. The mappings below convert these to seconds (multiplying by 60) to keep the data model consistent across sources.
To configure the mappings:
-
Go to your data sources page.
-
Find your LinearB integration in the list.
-
Click on the integration to open the mapping editor.
-
Add the resource mapping configurations below.
DORA metrics mapping (click to expand)
This mapping fetches organization-level DORA metrics for the last 30 days:
resources:- kind: /api/v2/measurementsselector:query: 'true'method: POSTbody: >-{"requested_metrics": [{"name": "releases.count"},{"name": "pm.mttr"},{"name": "pm.cfr.issues.done"}],"group_by": "organization","roll_up": "custom","time_ranges": [{"after": ((now - 2592000) | strftime("%Y-%m-%d")),"before": (now | strftime("%Y-%m-%d"))}],"return_no_data": true}data_path: '.[0].metrics'port:entity:mappings:identifier: '"linearb-dora-30d-" + (now | strftime("%Y-%m-%d"))'title: '"DORA metrics (30d) - " + (now | strftime("%Y-%m-%d"))'blueprint: '"engineering_metric"'properties:source: '"linearb"'category: '"dora"'window: '"30d"'start_date: '((now - 2592000) | strftime("%Y-%m-%dT00:00:00Z"))'end_date: '(now | strftime("%Y-%m-%dT00:00:00Z"))'deployment_count: '."releases.count"'deployment_frequency: '((."releases.count" // 0) / 30 * 100 | floor) / 100'mttr_minutes: '."pm.mttr"'change_failure_rate: '."pm.cfr.issues.done"'Pull request metrics by team mapping (click to expand)
This mapping fetches team-level pull request metrics for the last 30 days. Each team produces a separate entity:
- kind: /api/v2/measurementsselector:query: 'true'method: POSTbody: >-{"requested_metrics": [{"name": "branch.computed.cycle_time", "agg": "avg"},{"name": "branch.time_to_review", "agg": "avg"},{"name": "branch.review_time", "agg": "avg"},{"name": "branch.time_to_prod", "agg": "avg"},{"name": "branch.time_to_pr", "agg": "avg"},{"name": "pr.merged"},{"name": "branch.state.active"},{"name": "commit.activity_days"}],"group_by": "team","roll_up": "custom","time_ranges": [{"after": ((now - 2592000) | strftime("%Y-%m-%d")),"before": (now | strftime("%Y-%m-%d"))}],"return_no_data": true}data_path: '.[0].metrics'port:entity:mappings:identifier: '"linearb-pr-" + (.team_name | ascii_downcase | gsub("[^a-z0-9]+"; "-") | ltrimstr("-") | rtrimstr("-")) + "-30d-" + (now | strftime("%Y-%m-%d"))'title: '.team_name + " - PR metrics (30d)"'blueprint: '"engineering_metric"'properties:source: '"linearb"'category: '"pull_request"'window: '"30d"'start_date: '((now - 2592000) | strftime("%Y-%m-%dT00:00:00Z"))'end_date: '(now | strftime("%Y-%m-%dT00:00:00Z"))'team_name: .team_namecycle_time_seconds: '(."branch.computed.cycle_time:avg" // 0) * 60'time_to_first_review_seconds: '(."branch.time_to_review:avg" // 0) * 60'review_time_seconds: '(."branch.review_time:avg" // 0) * 60'merge_time_seconds: '(."branch.time_to_prod:avg" // 0) * 60'change_lead_time_minutes: '(."branch.computed.cycle_time:avg" // 0)'prs_merged_per_week: '((."pr.merged" // 0) / 4.29 * 10 | floor) / 10'prs_in_progress: '."branch.state.active"'contributors: '."commit.activity_days"'relations:team: '.team_name | ascii_downcase | gsub("[^a-z0-9]+"; "-") | ltrimstr("-") | rtrimstr("-")'Relating metrics to your catalogThe
teamrelation attempts to match LinearB team names to Port_teamentities by slugifying the team name (e.g.Platform Teambecomesplatform-team). If no matching team exists, the relation will be empty but the entity will still be created.
Visualize metrics
Once the integration has synced at least once, your portal contains LinearB metrics alongside GitHub services, pull requests, and teams.
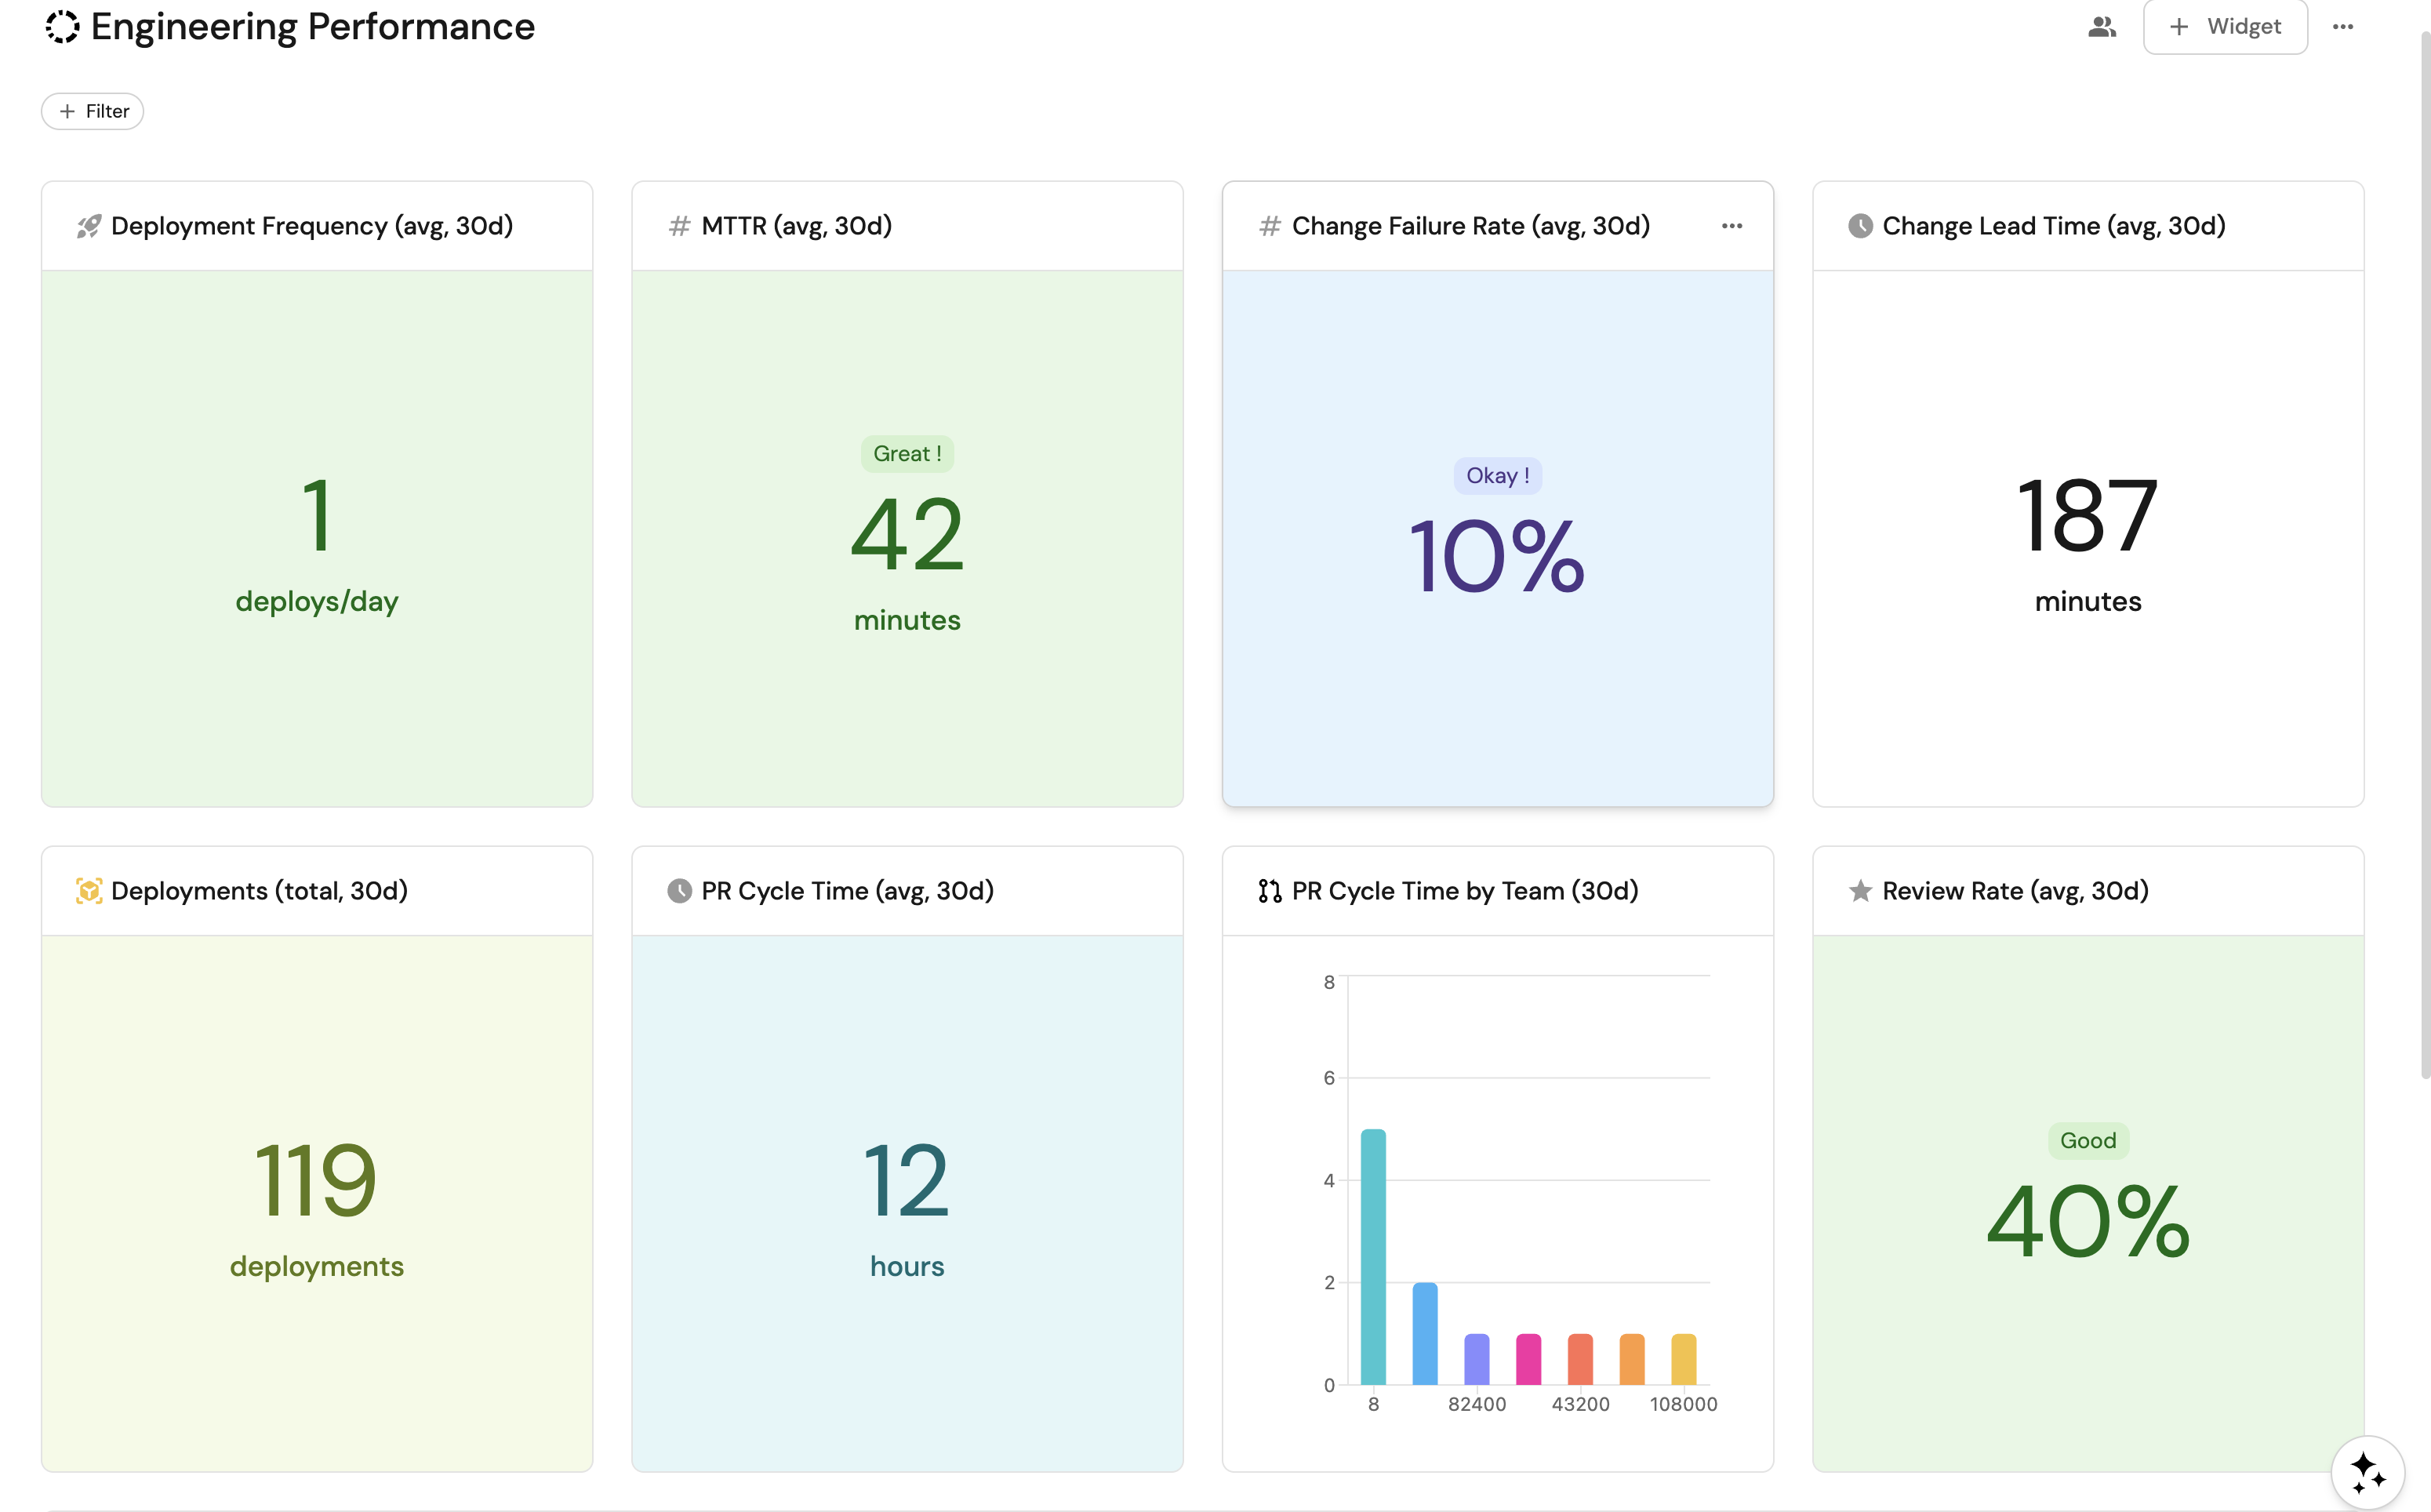
If this is your first external metrics integration, follow the dashboard setup below.
Create a dashboard
-
Navigate to the Catalog page of your portal.
-
Click on the
+button in the left sidebar. -
Select New dashboard.
-
Name the dashboard Engineering Performance.
-
Input
Track engineering metrics from LinearB alongside GitHub services and teamsunder Description. -
Select the
Analyticsicon. -
Click Create.
Add widgets
Deployment frequency widget (click to expand)
-
Click
+ Widgetand select Number Chart. -
Fill in the following details:
- Title:
Deployment Frequency (avg, 30d). - Icon:
Rocket. - Blueprint:
engineering_metric. - Chart type:
Aggregate by property. - Property:
deployment_frequency. - Function:
Average. - Average of:
total. - Custom unit:
deploys/day. - Add a filter:
category=doraandwindow=30d.
- Title:
-
Click Save.
Change lead time widget (click to expand)
-
Click
+ Widgetand select Number Chart. -
Fill in the following details:
- Title:
Change Lead Time (avg, 30d). - Icon:
Clock. - Blueprint:
engineering_metric. - Chart type:
Aggregate by property. - Property:
change_lead_time_minutes. - Function:
Average. - Average of:
total. - Custom unit:
minutes. - Add a filter:
category=doraandwindow=30d.
- Title:
-
Click Save.
MTTR widget (click to expand)
-
Click
+ Widgetand select Number Chart. -
Fill in the following details:
- Title:
MTTR (avg, 30d). - Icon:
Metrics. - Blueprint:
engineering_metric. - Chart type:
Aggregate by property. - Property:
mttr_minutes. - Function:
Average. - Average of:
total. - Custom unit:
minutes. - Add a filter:
category=doraandwindow=30d.
- Title:
-
Click Save.
PR cycle time widget (click to expand)
-
Click
+ Widgetand select Number Chart. -
Fill in the following details:
- Title:
PR Cycle Time (avg, 30d). - Icon:
Clock. - Blueprint:
engineering_metric. - Chart type:
Aggregate by property. - Property:
cycle_time_hours. - Function:
Average. - Average of:
total. - Custom unit:
hours. - Add a filter:
category=pull_requestandwindow=30d.
- Title:
-
Click Save.
Metrics by source pie chart (click to expand)
-
Click
+ Widgetand select Pie chart. -
Fill in the following details:
- Title:
Metrics by Source. - Icon:
Analytics. - Blueprint:
engineering_metric. - Breakdown by property:
source.
- Title:
-
Click Save.
Metrics by team pie chart (click to expand)
-
Click
+ Widgetand select Pie chart. -
Fill in the following details:
- Title:
PR Metrics by Team (30d). - Icon:
Team. - Blueprint:
engineering_metric. - Breakdown by property:
team_name. - Add a filter:
category=pull_requestandwindow=30d.
- Title:
-
Click Save.
Engineering metrics table (click to expand)
-
Click
+ Widgetand select Table. -
Fill in the following details:
- Title:
Engineering Metrics. - Blueprint:
engineering_metric.
- Title:
-
Click Save.
-
Click
...on the widget and select Customize table. -
Under Manage Properties, add:
source.category.window.team_name.deployment_frequency.change_lead_time_minutes.mttr_minutes.cycle_time_hours.prs_merged_per_week.end_date.
-
Click the save icon in the top right corner of the widget.
Build these metrics natively in Port
Importing LinearB data helps during a transition, but Port can produce the same metrics without a third-party analytics tool. Port's built-in integrations pull data from your source control, CI/CD pipelines, project management tools, and AI coding assistants, then compute metrics directly inside the catalog.
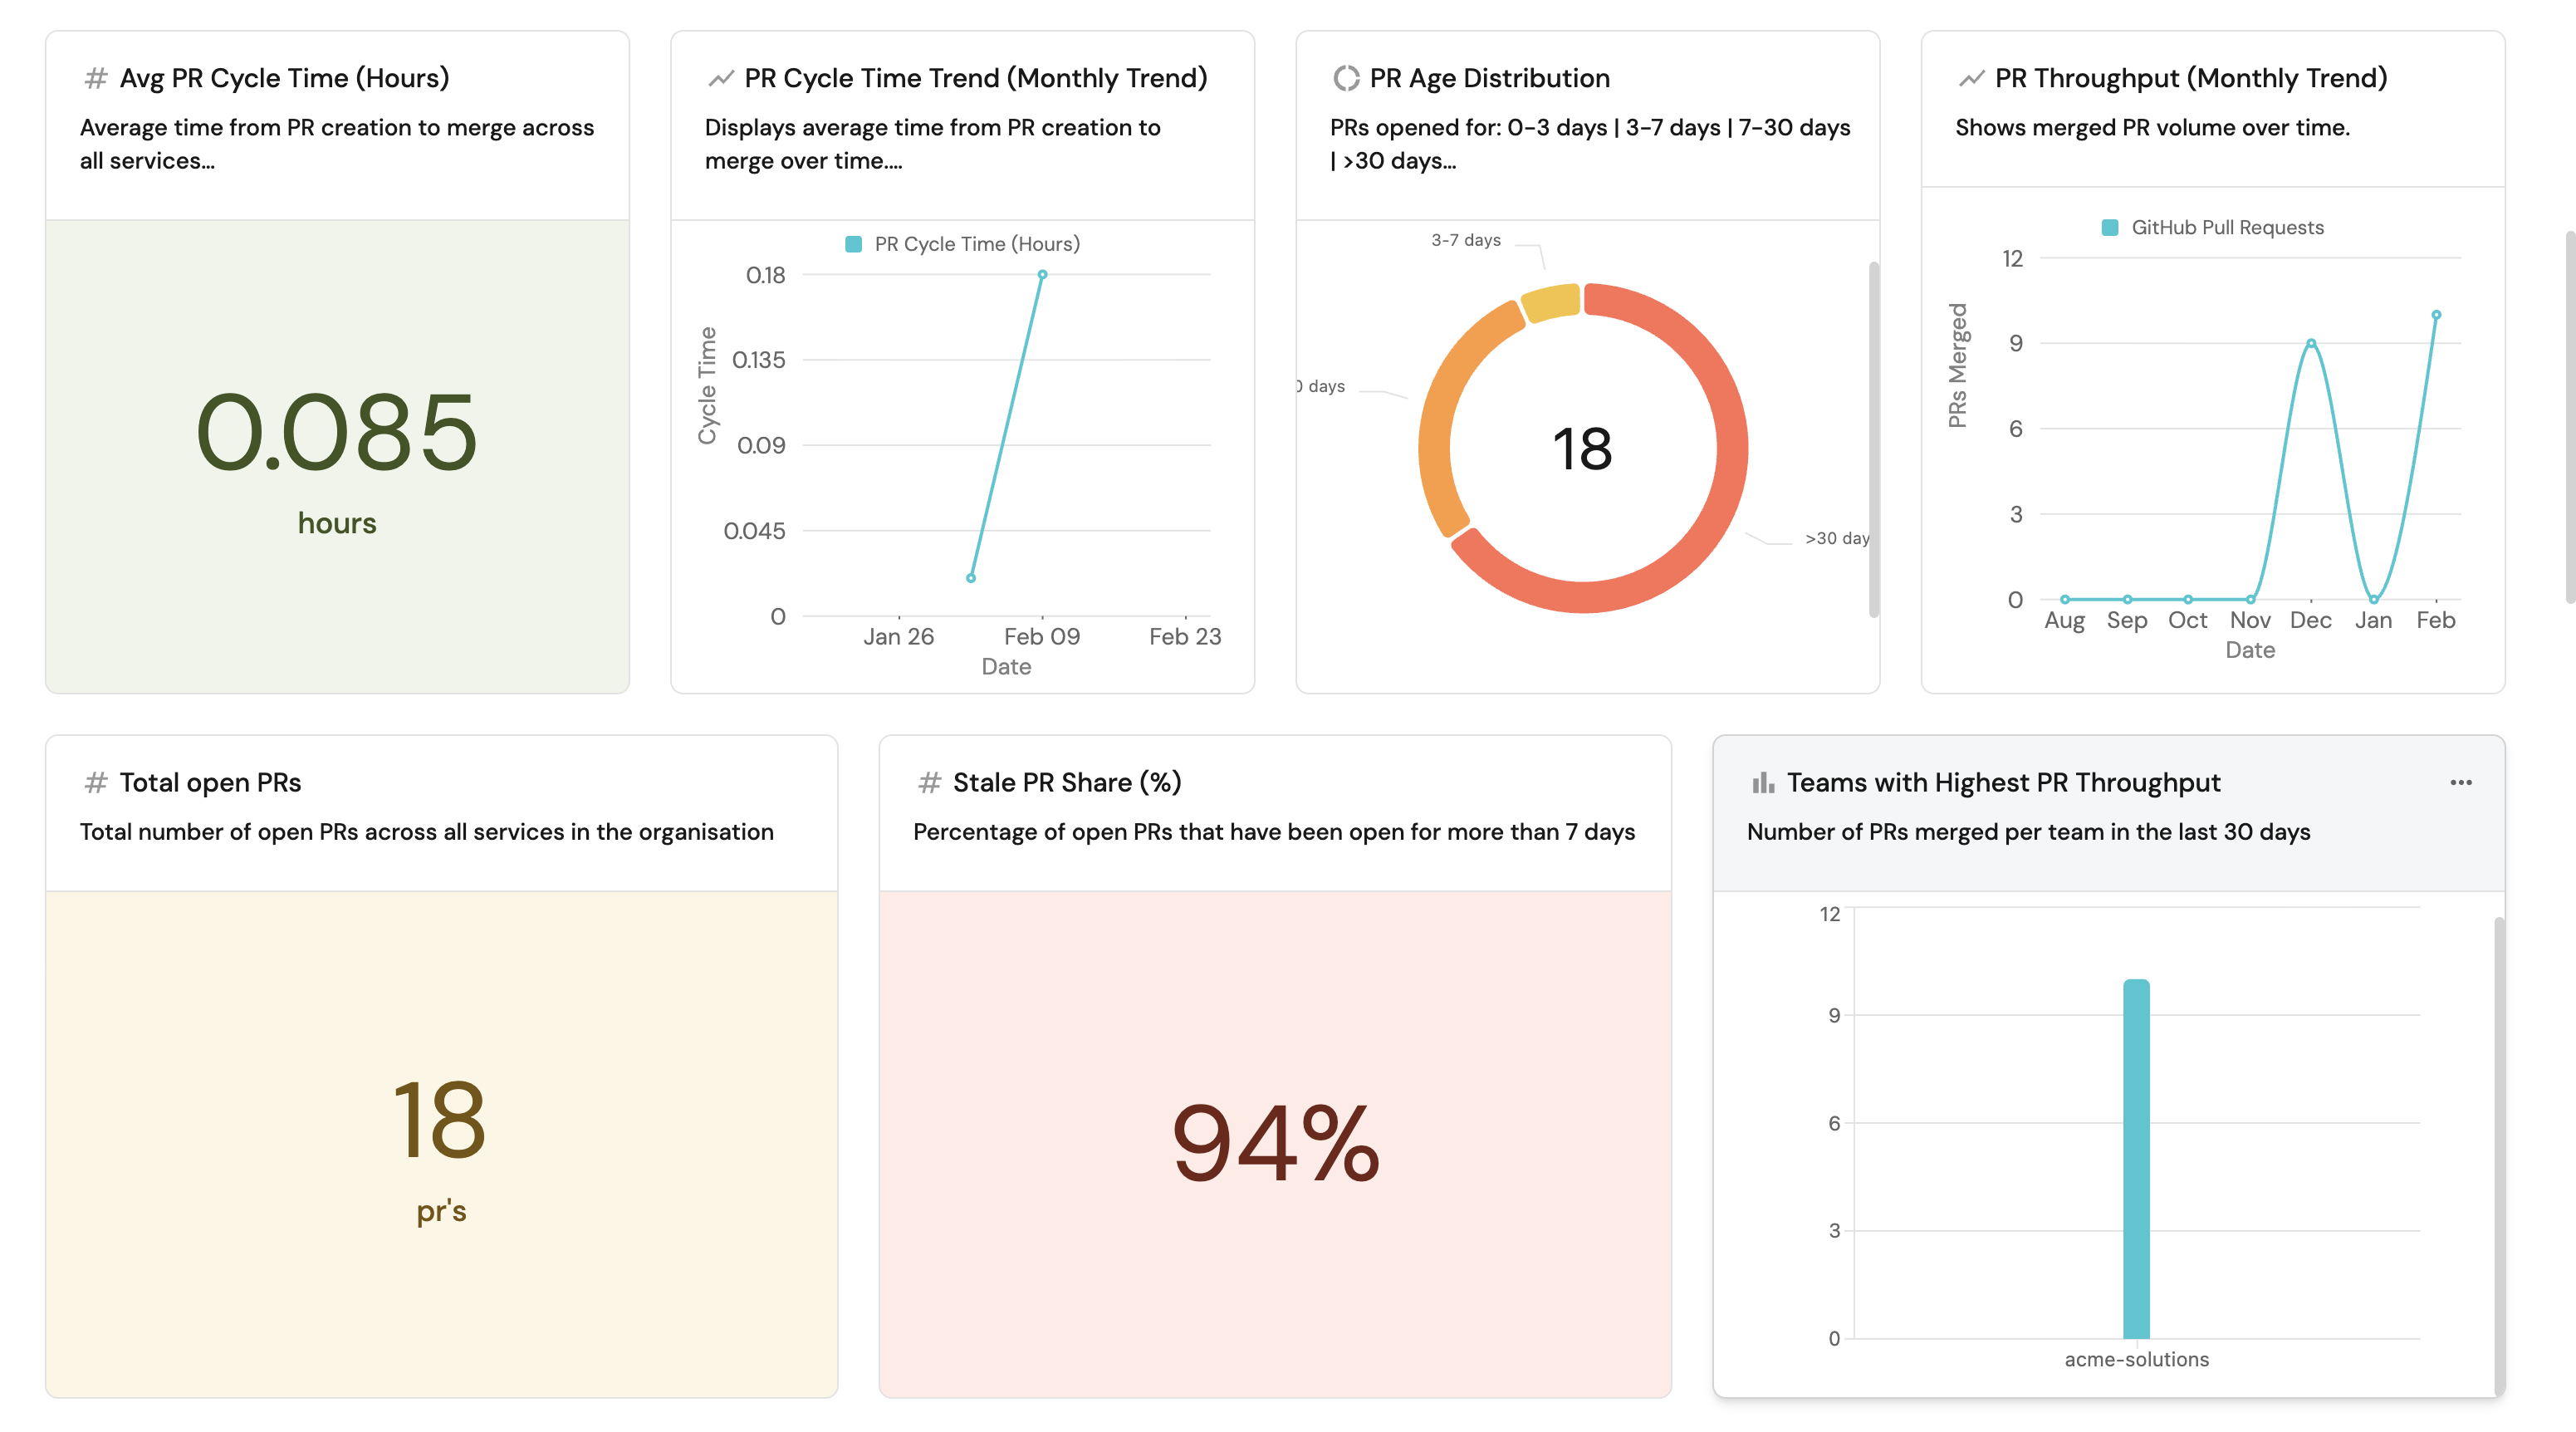
Metrics like PR throughput, cycle time, deployment frequency, and review health are derived automatically using aggregation properties and calculation properties. You can slice them by service, team, group, or organization, and correlate with ownership data, Jira issues, AI adoption metrics, and anything else in your catalog.
Integration coverage
Port connects to tools across the full SDLC source control, planning, security, infrastructure, CI/CD, and AI coding tools through various integrations. Check Port's integration library for available integrations. Data flows into the catalog continuously, ready to power dashboards, scorecards, and automations without any custom ingestion code.
Related guides
Dive deeper into Port's native Engineering Intelligence:
- Measure PR delivery metrics — derive cycle time, throughput, review health, and deployment frequency from GitHub, GitLab, or Azure DevOps.
- Set up DORA metrics — track deployment frequency, lead time, change failure rate, and MTTR without external tooling.
- Track AI adoption and impact — quantify how tools like Claude, Cursor, and Copilot affect productivity and quality.
- Enforce AI coding security standards — validate that AI-generated code meets your organization's security policies.
Next steps
- Why Port for Engineering Intelligence — discover how Port's context lake, scorecards, agentic workflows, and AI agents create a closed loop from measurement to action.