Track AI adoption and impact
Tracking AI adoption provides visibility into how engineering teams are leveraging AI coding agents and the impact these tools have on delivery outcomes. Without visibility into AI usage patterns, teams struggle to understand adoption rates, measure productivity gains, and identify which teams or services benefit most from AI assistance.
This guide helps engineering managers, platform engineers, and product leaders answer critical questions about AI adoption:
- Adoption: Which teams and services are using AI coding tools?
- Impact: How does AI assistance affect PR throughput and cycle time?
- Effectiveness: Are AI-assisted PRs delivering faster or higher quality outcomes?
- Cost optimization: Are AI tool licenses being fully utilized?
By the end of this guide, we will have dashboards that track AI adoption metrics, enabling you to understand usage patterns, measure productivity impact, and make informed decisions about AI tool investments across your organization.
Common use cases
- Compare PR throughput and cycle time between AI-assisted and traditional workflows.
- Identify teams and services with the highest AI adoption rates.
- Track AI usage trends over time to understand adoption patterns.
- Monitor AI tool license utilization and revoke unused licenses to optimize costs.
- Correlate AI adoption with operational metrics like bug rates and incident resolution time.
Prerequisites
This guide assumes the following:
- You have a Port account and have completed the onboarding process.
- Port's GitHub Ocean integration is installed in your account.
- The
githubPullRequestandgithubRepositoryblueprints are already created (these are created when you install GitHub Ocean). - For Cursor tracking: Port's Cursor integration is installed in your account, with the
cursor_usage_record,cursor_user_usage_record, andcursor_team_usage_recordblueprints created as described in the Cursor integration setup. - For Copilot tracking: Port's GitHub Copilot integration is installed in your account.
- For AI impact on operations: Port's Jira integration is installed in your account (optional, for tracking bugs, security issues, and incidents).
- For the AI Impact Insights widget: Port AI is enabled in your account.
Set up data model
We will create and update blueprints to support AI adoption tracking.
Update the pull request blueprint
Regardless of which AI tool you're tracking, you need to add a property to identify AI-assisted PRs.
-
Go to the Data model page in Port.
-
Find the
githubPullRequestblueprint and click on it. -
Click on the
{...}button in the top right corner, and chooseEdit JSON. -
Add the following property to the
propertiessection:AI agent property for Pull Request blueprint (click to expand)
"created_by_agent": {"type": "boolean","title": "Created By AI Agent","description": "Determines whether or not the PR was created by an AI agent such as Copilot, Claude, or Devin"} -
Click
Saveto update the blueprint.
Update the Jira issue blueprint
To correlate AI adoption with operational metrics like bug resolution and incident response time, we need to add properties to track issue categories and lead time.
-
Go to the Data model page in Port.
-
Find the
jiraIssueblueprint and click on it. -
Click on the
{...}button in the top right corner, and chooseEdit JSON. -
Add the following properties to the
propertiessection:Issue category and lead time properties (click to expand)
"issue_category": {"title": "Issue Category","type": "string","enum": ["Bug", "Security Issues", "Incidents", "Other"],"enumColors": {"Bug": "red","Security Issues": "orange","Incidents": "pink","Other": "lightGray"},"description": "Category of the issue for tracking purposes"},"lead_time_hours": {"title": "Lead Time (Hours)","type": "number","description": "Time from issue creation to resolution in hours"} -
Click
Saveto update the blueprint.
Update integration mapping
Now we'll configure the GitHub integration to detect AI-assisted PRs and Jira issues to populate the issue category and lead time properties.
GitHub integration mapping
-
Go to your Data Source page.
-
Select the GitHub integration.
-
Add or update the following YAML block in the editor. Choose your integration type:
GitHub Ocean integration configuration (click to expand)
Ocean property mappingFor GitHub Ocean, map
statusfrom.statein your entity mappings, and use.__repositoryfor the repository relation. See the GitHub Ocean migration guide for details.resources:- kind: repositoryselector:query: 'true'include: ["teams"]includedFiles:- README.mdport:entity:mappings:identifier: .full_nametitle: .nameblueprint: '"githubRepository"'properties:readme: .__includedFiles["README.md"]url: .html_urldefaultBranch: .default_branchlast_push: .pushed_atvisibility: .visibilitylanguage: .language- kind: pull-requestselector:query: 'true'states: ["open", "closed"]maxResults: 100since: 90port:entity:mappings:identifier: .id|tostringtitle: .titleblueprint: '"githubPullRequest"'properties:status: .stateclosedAt: .closed_atupdatedAt: .updated_atmergedAt: .merged_atcreatedAt: .created_atlink: .html_urlcreated_by_agent: .user.login | ascii_downcase | test("(copilot|claude|devin)")leadTimeHours: >-(.created_at as $createdAt | .merged_at as $mergedAt | ($createdAt| sub("\\..*Z$"; "Z") | strptime("%Y-%m-%dT%H:%M:%SZ") | mktime)as $createdTimestamp | ($mergedAt | if . == null then null elsesub("\\..*Z$"; "Z") | strptime("%Y-%m-%dT%H:%M:%SZ") | mktime end)as $mergedTimestamp | if $mergedTimestamp == null then null else(((($mergedTimestamp - $createdTimestamp) / 3600) * 100 | floor) /100) end)pr_age: >-((now - (.created_at | sub("\\.[0-9]+Z$"; "Z") | fromdateiso8601))/ 86400) | roundcycle_time: >-if .merged_at then (((.merged_at | sub("\\.[0-9]+Z$"; "Z") |fromdateiso8601) - (.created_at | sub("\\.[0-9]+Z$"; "Z") |fromdateiso8601)) / 86400 | round) else null endrelations:repository: .__repositoryAI agent detectionThe mapping uses a regex pattern to detect AI agents by checking if the PR creator's username contains "copilot", "claude", or "devin" (case-insensitive). You can customize this pattern to match your organization's AI agent naming conventions.
-
Click
Save & Resyncto apply the mapping.
Configure Jira integration mapping
-
Go to your Data Source page.
-
Select the Jira integration.
-
Update the
jiraIssuemapping to include the new properties:Jira integration mapping for issue properties (click to expand)
- kind: issueselector:query: 'true'port:entity:mappings:identifier: .keytitle: .fields.summaryblueprint: '"jiraIssue"'properties:# ... existing properties ...issue_category: |if .fields.labels | any(. == "security") then "Security Issues"elif .fields.issuetype.name == "Bug" then "Bug"elif .fields.issuetype.name == "Incident" then "Incidents"else "Other" endlead_time_hours: |if .fields.resolutiondate != null then((.fields.resolutiondate | fromdateiso8601) - (.fields.created | fromdateiso8601)) / 3600 | roundelsenullendIssue category logicThe mapping categorizes issues based on labels and issue type. Issues with a "security" label are classified as Security Issues, Bug types as Bug, and Incident types as Incidents. You can customize this logic to match your organization's issue classification.
-
Click
Save & Resyncto apply the mapping.
Visualize metrics
Once the data is synced, we can create a dedicated dashboard in Port to monitor and analyze AI adoption and impact metrics.
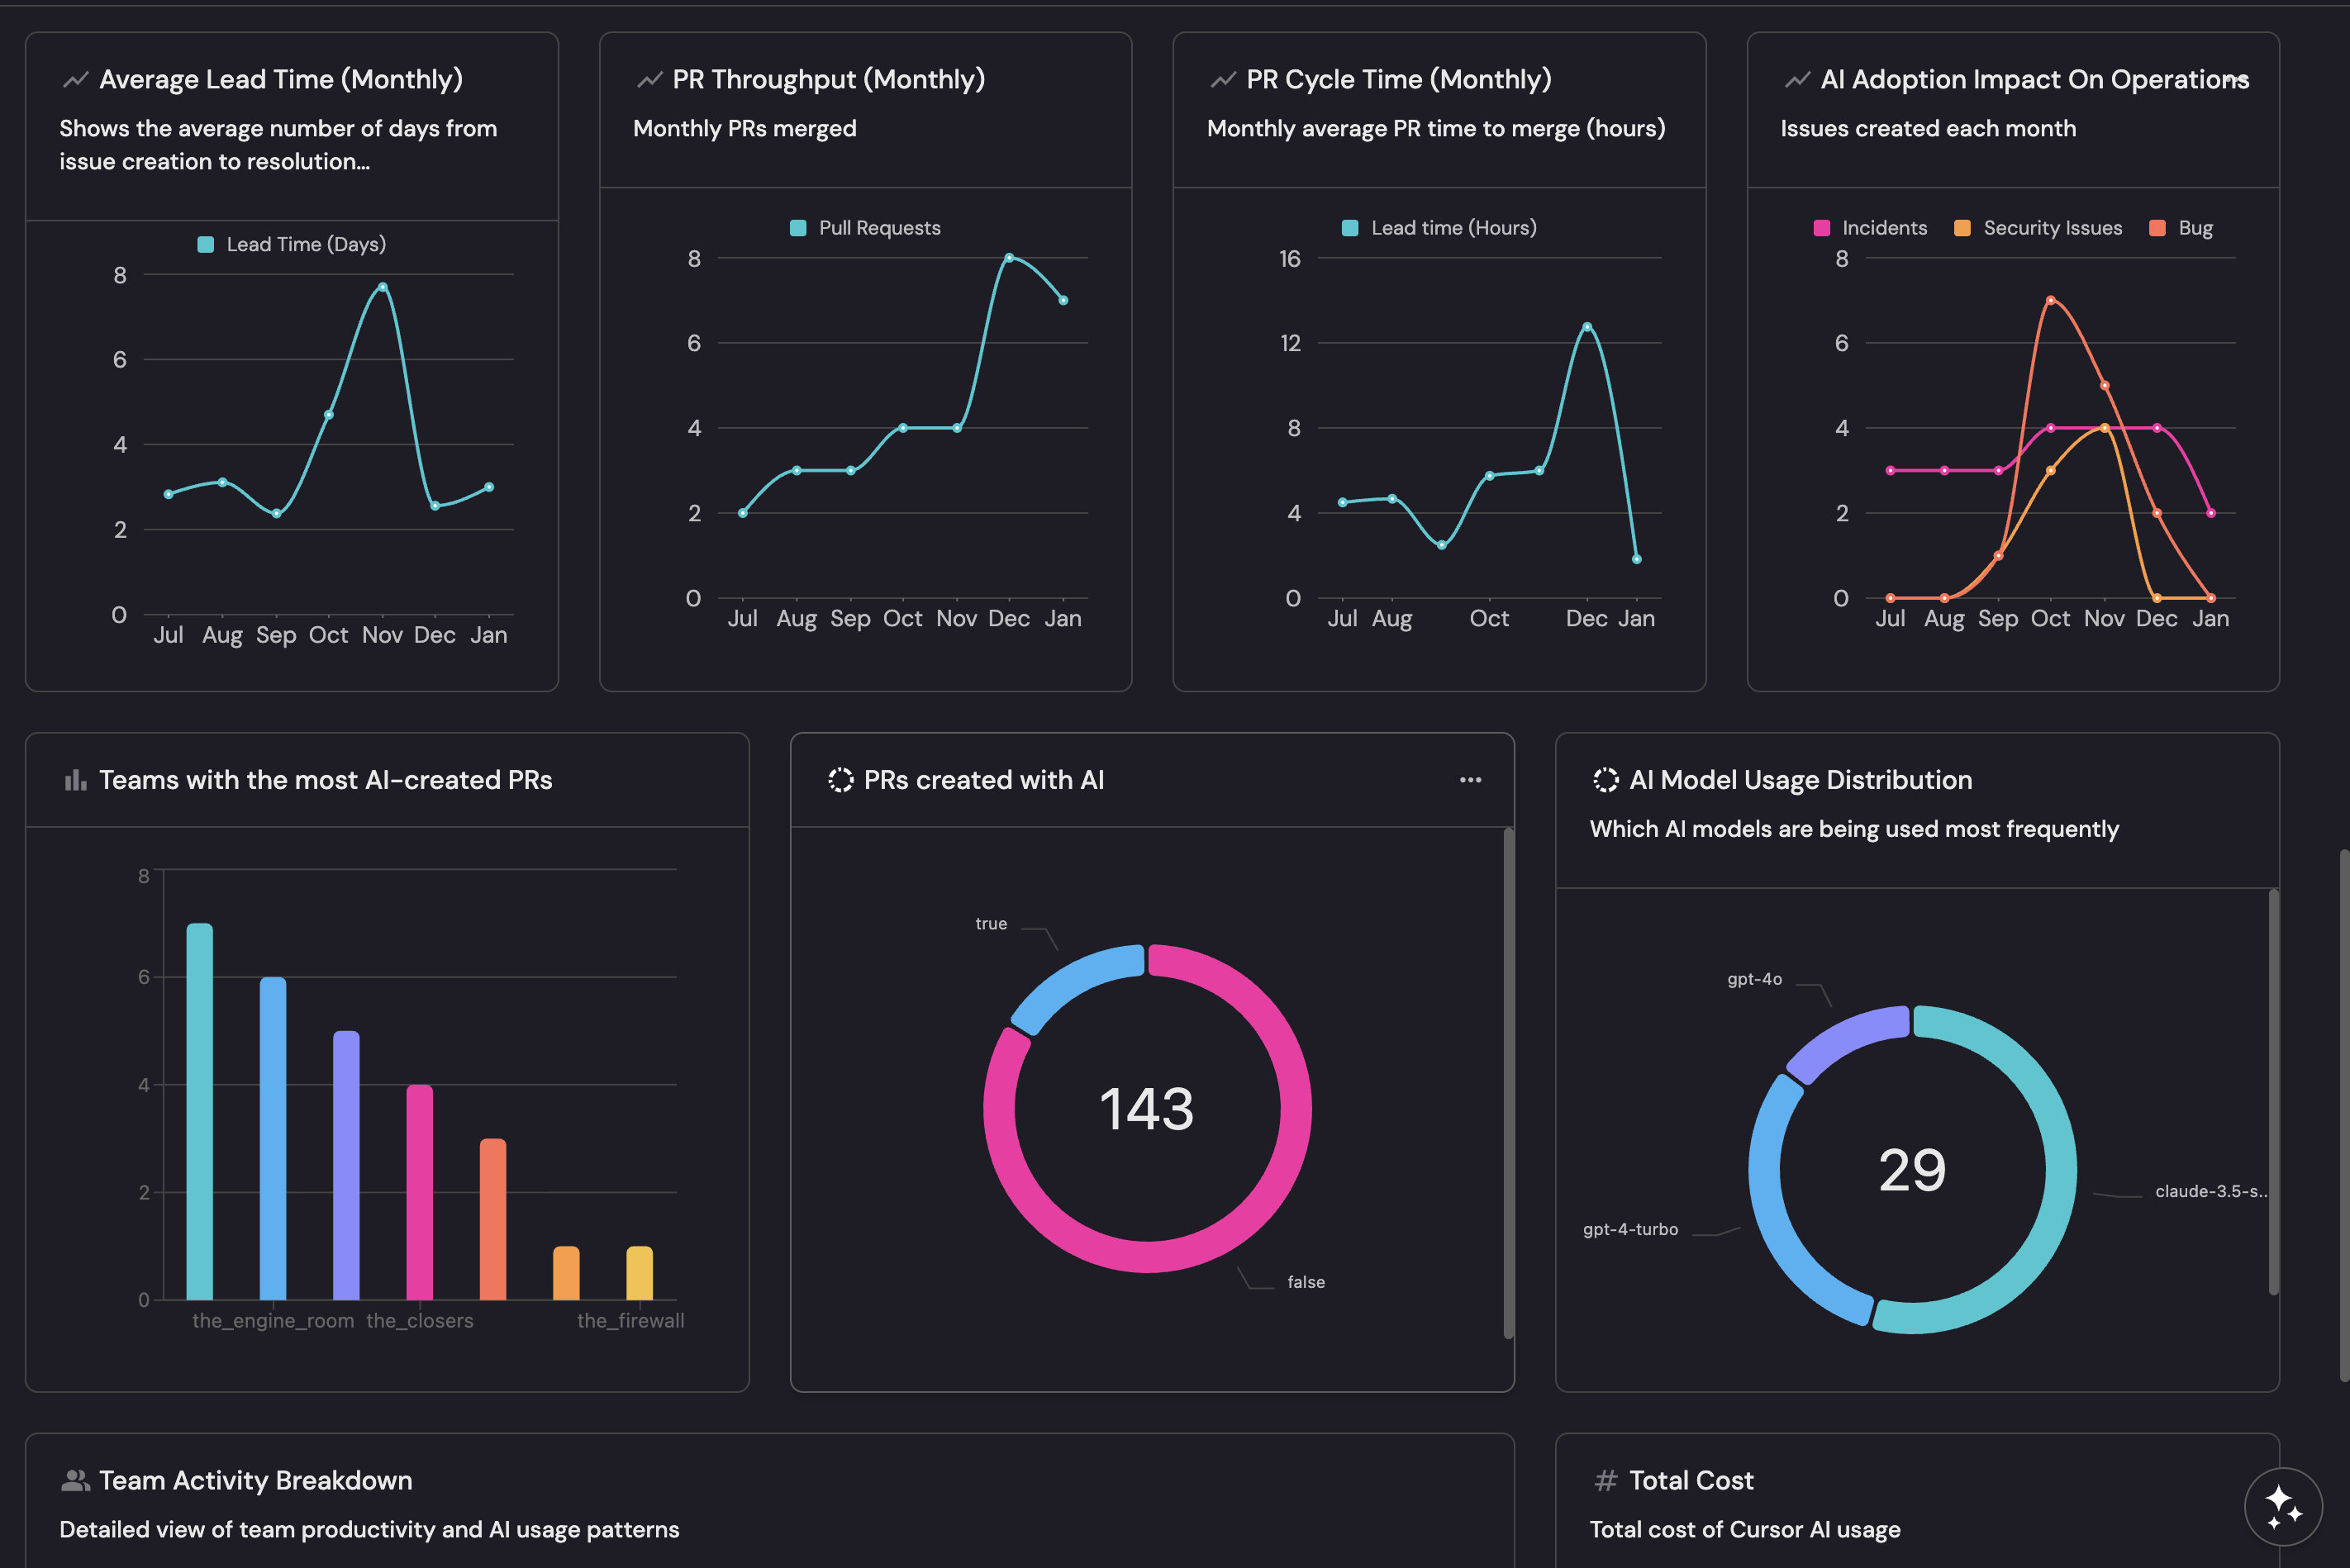
Create a dashboard
- Navigate to your context lake.
- Click on the
+button in the left sidebar. - Select New dashboard.
- Name the dashboard AI Adoption and Impact.
- Click
Create.
We now have a blank dashboard where we can start adding widgets to visualize AI adoption metrics.
Add widgets
In the new dashboard, create the following widgets to match the demo dashboard. Some widgets require the Cursor integration, while others work with any AI tool.
Widgets that use the cursor_usage_record, cursor_user_usage_record, or cursor_team_usage_record blueprints require Port's Cursor integration to be installed and syncing data.
Cursor adoption across users pie chart (click to expand)
This chart shows the distribution of active vs inactive Cursor users, giving a quick view of adoption across your organization.
- Click
+ Widgetand select Pie chart. - Title:
Cursor Adoption Across Users. - Description:
Based on active usage. - Choose the User blueprint.
- Under
Breakdown by property, select the Cursor Active property. - Click
Save.
Total number of active Cursor users (monthly) line chart (click to expand)
- Click
+ Widgetand select Line Chart. - Title:
Total Number of Active Cursor Users (Monthly). - Description:
Active Cursor Users during the month. - Set X axis:
- Title:
Date. - Time interval:
Month. - Time range:
In the past 6 months.
- Title:
- Set Y axis title:
Number of Users. - Click + Line and configure:
- Title:
Total Active Users. - Chart type:
Aggregate by property. - Blueprint:
Cursor Usage Record. - Property:
total_active_users. - Function:
Sum. - Measure time by:
record_date.
- Title:
- Click
Save.
AI Cursor usage trend over time line chart (click to expand)
This chart tracks AI coding activity over time, showing the trend of rejected suggestions and lines of code added or deleted.
- Click
+ Widgetand select Line Chart. - Title:
AI Cursor Usage Trend Over Time. - Description:
Track AI coding activity over time. - Set X axis:
- Title:
Date. - Time interval:
Week. - Time range:
In the past 30 days.
- Title:
- Set Y axis title:
Count. - Click + Line and configure:
- Title:
Total Rejects. - Chart type:
Aggregate by property. - Blueprint:
Cursor Usage Record. - Property:
Total Rejects. - Function:
Average. - Measure time by:
record_date.
- Title:
- Click + Line and configure:
- Title:
Total Lines Added. - Chart type:
Aggregate by property. - Blueprint:
Cursor Usage Record. - Property:
Total Lines Added. - Function:
Average. - Measure time by:
record_date.
- Title:
- Click + Line and configure:
- Title:
Total Lines Deleted. - Chart type:
Aggregate by property. - Blueprint:
Cursor Usage Record. - Property:
Total Lines Deleted. - Function:
Average. - Measure time by:
record_date.
- Title:
- Click
Save.
Daily cost trends line chart (click to expand)
- Click
+ Widgetand select Line Chart. - Title:
Daily Cost Trends. - Description:
Track AI usage costs over time. - Set X axis:
- Title:
Date. - Time interval:
Week. - Time range:
In the past 30 days.
- Title:
- Set Y axis title:
Cost. - Click + Line and configure:
- Title:
Total Cost. - Chart type:
Aggregate by property. - Blueprint:
Cursor Usage Record. - Property:
total_cents. - Function:
Sum. - Measure time by:
record_date.
- Title:
- Click
Save.
Average Lead Time (Monthly) line chart (click to expand)
-
Click
+ Widgetand select Line Chart. -
Title:
Average Lead Time (Monthly). -
Description:
Shows the average number of days from issue creation to resolution. -
Set X axis:
- Title:
Date. - Time interval:
Month. - Time range:
In the past 6 months.
- Title:
-
Set Y axis title:
Lead Time (Days). -
Click + Line and configure:
-
Title:
Lead Time. -
Chart type:
Aggregate by property. -
Blueprint:
Pull Request. -
Property:
leadTimeHours. -
Function:
Average. -
Measure time by:
createdAt. -
Initial filters:
{"combinator": "and","rules": [{"value": "merged","property": "status","operator": "="}]}
-
-
Click
Save.
PR Throughput (Monthly) line chart (click to expand)
-
Click
+ Widgetand select Line Chart. -
Title:
PR Throughput (Monthly). -
Description:
Monthly PRs merged. -
Set X axis:
- Title:
Date. - Time interval:
Month. - Time range:
In the past 6 months.
- Title:
-
Set Y axis title:
Pull Requests. -
Click + Line and configure:
-
Title:
PR Count. -
Chart type:
Count entities. -
Blueprint:
Pull Request. -
Function:
Count. -
Measure time by:
createdAt. -
Initial filters:
{"combinator": "and","rules": [{"value": "merged","property": "status","operator": "="}]}
-
-
Click
Save.
PR Cycle Time (Monthly) line chart (click to expand)
-
Click
+ Widgetand select Line Chart. -
Title:
PR Cycle Time (Monthly). -
Description:
Monthly average PR time to merge (hours). -
Set X axis:
- Title:
Date. - Time interval:
Month. - Time range:
In the past 6 months.
- Title:
-
Set Y axis title:
Lead time (Hours). -
Click + Line and configure:
-
Title:
Cycle Time. -
Chart type:
Aggregate by property. -
Blueprint:
Pull Request. -
Property:
cycle_time. -
Function:
Average. -
Measure time by:
createdAt. -
Initial filters:
{"combinator": "and","rules": [{"value": "merged","property": "status","operator": "="}]}
-
-
Click
Save.
AI adoption impact on operations line chart (click to expand)
This chart shows the monthly trend of bugs, security issues, and incidents to help correlate AI adoption with operational quality.
-
Click
+ Widgetand select Line Chart. -
Title:
AI Adoption Impact On Operations. -
Description:
Issues created each month. -
Set X axis:
- Title:
Date. - Time interval:
Month. - Time range:
In the past 6 months.
- Title:
-
Set Y axis title:
Issues. -
Click + Line and configure:
-
Title:
Issue Count. -
Chart type:
Count entities. -
Blueprint:
Jira Issue. -
Breakdown by property:
Issue Category. -
Measure time by:
createdAt. -
Initial filters (to only show relevant categories):
{"combinator": "and","rules": [{"property": "issue_category","operator": "in","value": ["Bug", "Security Issues", "Incidents"]}]}
-
-
Click
Save.
Teams with the most AI-created PRs bar chart (click to expand)
-
Click
+ Widgetand select Bar Chart. -
Title:
Teams with the most AI-created PRs. -
Choose the Pull Request blueprint.
-
Under
Breakdown by property, select the Owning Team property (via repository relation). -
Add this JSON to the Initial filters editor:
{"combinator": "and","rules": [{"value": true,"property": "created_by_agent","operator": "="}]} -
Click
Save.
PRs created with AI pie chart (click to expand)
- Click
+ Widgetand select Pie chart. - Title:
PRs Created with AI. - Choose the Pull Request blueprint.
- Under
Breakdown by property, select the Created By AI Agent property. - Click
Save.
AI model usage distribution pie chart (click to expand)
This chart shows which AI models are being used most frequently across your organization.
- Click
+ Widgetand select Pie chart. - Title:
AI Model Usage Distribution. - Description:
Which AI models are being used most frequently. - Choose the Cursor Usage Record blueprint.
- Under
Breakdown by property, select the Most Used Model property. - Click
Save.
Team activity breakdown table (click to expand)
This table provides a per-team view of Cursor AI usage, showing how each team is adopting AI tools and their acceptance rates.
- Click
+ Widgetand select Table. - Title:
Team Activity Breakdown. - Description:
Detailed view of team productivity and AI usage patterns. - Choose the Cursor Team Usage Record blueprint.
- Click
Saveto add the widget to the dashboard. - Click on the
...button in the top right corner of the table and select Customize table. - In the top right corner of the table, click on
Manage Propertiesand add the following columns:- Team: The team name.
- Total Lines Added: Total lines of code added with AI assistance.
- Agent Requests: Number of AI agent requests made.
- Input Tokens: Total input tokens consumed.
- Output Tokens: Total output tokens generated.
- Total Rejects: Number of AI suggestions rejected.
- Total Accepts: Number of AI suggestions accepted.
- Acceptance Rate: Percentage of AI suggestions accepted.
- Click on the save icon in the top right corner of the widget to save the customized table.
Total cost number chart (click to expand)
- Click
+ Widgetand select Number Chart. - Title:
Total Cost. - Description:
Total cost of Cursor AI usage. - Choose the Cursor Usage Record blueprint.
- Select
Aggregate by propertyChart type. - Select
total_centsas the Property. - Select
sumfor the Function. - Select
$as the Unit. - Click
Save.