Track and show MTBF for services
This guide demonstrates how to implement Mean Time Between Failures (MTBF) tracking for your PagerDuty services using Port. MTBF measures the average time between service failures and helps identify reliability trends.
MTBF = Total Operational Time ÷ Number of Failures
For example: A service running 720 hours with 3 incidents has an MTBF of 240 hours. Higher MTBF values indicate better reliability.
Common use cases
- Reliability monitoring: Track how often your services fail and identify patterns over time.
- SLA compliance: Monitor service reliability against defined targets and SLAs.
- Incident reduction: Identify the most unreliable services that need improvement focus.
- Team accountability: Track reliability metrics by team and service ownership.
- Capacity planning: Use historical failure patterns to inform infrastructure decisions.
Prerequisites
This guide assumes the following:
- You have a Port account and have completed the onboarding process.
- Port's PagerDuty integration is installed in your account.
- Access to your PagerDuty organization with incident data for your services.
Set up data model
If you haven't installed the PagerDuty integration, you'll need to create blueprints for PagerDuty services and incidents.
However, we highly recommend installing the PagerDuty integration to have these automatically set up for you.
Create PagerDuty service blueprint
-
Go to the Data model page in Port.
-
Click on
+ Blueprint. -
Click on the
{...} Edit JSONbutton. -
Copy and paste the following JSON configuration:
PagerDuty Service Blueprint (click to expand)
{"identifier": "pagerdutyService","description": "This blueprint represents a PagerDuty service in our context lake","title": "PagerDuty Service","icon": "pagerduty","schema": {"properties": {"status": {"title": "Status","type": "string","enum": ["active","warning","critical","maintenance","disabled"],"enumColors": {"active": "green","warning": "yellow","critical": "red","maintenance": "lightGray","disabled": "darkGray"}},"url": {"title": "URL","type": "string","format": "url"},"oncall": {"title": "On Call","type": "string","format": "user"},"meanSecondsToResolve": {"title": "Mean Seconds to Resolve","type": "number"},"meanSecondsToFirstAck": {"title": "Mean Seconds to First Acknowledge","type": "number"},"meanSecondsToEngage": {"title": "Mean Seconds to Engage","type": "number"}},"required": []},"mirrorProperties": {},"calculationProperties": {},"relations": {}} -
Click
Save.
Create PagerDuty incident blueprint
-
Go to the Data model page in Port.
-
Click on
+ Blueprint. -
Click on the
{...} Edit JSONbutton. -
Copy and paste the following JSON configuration:
PagerDuty Incident Blueprint (click to expand)
{"identifier": "pagerdutyIncident","description": "This blueprint represents a PagerDuty incident in our context lake","title": "PagerDuty Incident","icon": "pagerduty","schema": {"properties": {"status": {"type": "string","title": "Incident Status","enum": ["triggered","annotated","acknowledged","reassigned","escalated","reopened","resolved"]},"url": {"type": "string","format": "url","title": "Incident URL"},"urgency": {"type": "string","title": "Incident Urgency","enum": ["high", "low"]},"responder": {"type": "string","title": "Assignee"},"escalation_policy": {"type": "string","title": "Escalation Policy"},"created_at": {"title": "Create At","type": "string","format": "date-time"},"updated_at": {"title": "Updated At","type": "string","format": "date-time"}},"required": []},"mirrorProperties": {},"calculationProperties": {},"relations": {"pagerdutyService": {"title": "PagerDuty Service","target": "pagerdutyService","required": false,"many": true}}} -
Click
Save.
Add aggregation properties
First, we need to add aggregation properties to count incidents over different time periods. These properties will count the number of PagerDuty incidents related to each service within specific time windows.
Follow the steps below to add aggregation properties to the PagerDuty Service blueprint:
-
Go to the Data model page in Port.
-
Click on the PagerDuty Service blueprint.
-
Click on the
...button in the top right corner, and chooseEdit JSON. -
Add these aggregation properties to the blueprint JSON:
Incident count aggregation properties (click to expand)
"incidents30Days": {"title": "Incidents (30 days)","icon": "Alert","description": "Number of incidents in the last 30 days","target": "pagerdutyIncident","calculationSpec": {"func": "count","calculationBy": "entities","filter": {"combinator": "and","rules": [{"operator": ">=","property": "created_at","value": "{{(now - 2592000) | strftime(\"%Y-%m-%dT%H:%M:%SZ\")}}"}]}},"type": "number"},"incidents90Days": {"title": "Incidents (90 days)","icon": "Alert","description": "Number of incidents in the last 90 days","target": "pagerdutyIncident","calculationSpec": {"func": "count","calculationBy": "entities","filter": {"combinator": "and","rules": [{"operator": ">=","property": "created_at","value": "{{(now - 7776000) | strftime(\"%Y-%m-%dT%H:%M:%SZ\")}}"}]}},"type": "number"} -
Click
Saveto update the blueprint.
Aggregation properties automatically count or aggregate data from related entities. In this case, they count PagerDuty incidents that are related to each service and filter them by creation date to get incident counts for the last 30 and 90 days.
Add MTBF calculation properties
Now we'll add calculation properties that use the aggregation properties to automatically compute MTBF metrics for each service:
-
Go to the Data model page in Port.
-
Click on the PagerDuty Service blueprint.
-
Click on the
...button in the top right corner, and chooseEdit JSON. -
Add these calculation properties to the blueprint JSON:
MTBF calculation properties (click to expand)
"mtbf_30_days": {"title": "MTBF (30 days)","icon": "ClockLoader","description": "Mean Time Between Failures over the past 30 days (in hours)","calculation": "if (.properties.incidents30Days // 0) > 0 then (30 * 24) / .properties.incidents30Days else null end","type": "number"},"mtbf_90_days": {"title": "MTBF (90 days)","icon": "ClockLoader","description": "Mean Time Between Failures over the past 90 days (in hours)","calculation": "if (.properties.incidents90Days // 0) > 0 then (90 * 24) / .properties.incidents90Days else null end","type": "number"} -
Click
Saveto update the blueprint.
Add MTBF target and threshold properties
Before creating self-service actions, we need to add properties for storing MTBF targets and alert thresholds:
-
Still in the PagerDuty Service blueprint JSON, add these properties to the
propertiessection:MTBF target and threshold properties (click to expand)
"mtbfTarget": {"title": "MTBF Target (hours)","type": "number","description": "Target mean time between failures in hours"},"mtbfCriticalThreshold": {"title": "Critical Threshold (%)","type": "number","description": "Percentage below target that triggers critical alert","default": 50},"mtbfWarningThreshold": {"title": "Warning Threshold (%)","type": "number","description": "Percentage below target that triggers warning","default": 75} -
Click
Saveto update the blueprint.
Set up self-service actions
Now let's create self-service actions to help teams monitor and improve MTBF for their services.
Add Port secrets
If you have already installed Port's PagerDuty integration, these secrets should already exist in Port. To view your existing secrets:
- Open the Credentials modal.
- Click on the
Secretstab.
First, add the required secrets to Port:
-
Open the Credentials modal.
-
Click on the
Secretstab. -
Click on
+ Secretand add the following secret:PAGERDUTY_API_KEY: Your PagerDuty API token.
Set reliability target action
Create an action to set MTBF targets for services:
-
Click on the
+ New Actionbutton. -
Click on the
{...} Edit JSONbutton. -
Copy and paste the following JSON configuration:
Set reliability target action (click to expand)
{"identifier": "set_mtbf_target","title": "Set MTBF Target","icon": "Pagerduty","description": "Set reliability targets and thresholds for the service","trigger": {"type": "self-service","operation": "DAY-2","userInputs": {"properties": {"mtbfTarget": {"title": "MTBF Target (hours)","type": "number","description": "Target mean time between failures in hours"},"criticalThreshold": {"title": "Critical Threshold (%)","type": "number","description": "Percentage below target that triggers critical alert","default": 50},"warningThreshold": {"title": "Warning Threshold (%)","type": "number","description": "Percentage below target that triggers warning","default": 75}},"required": ["mtbfTarget"],"order": ["mtbfTarget", "criticalThreshold", "warningThreshold"]},"blueprintIdentifier": "pagerdutyService"},"invocationMethod": {"type": "UPSERT_ENTITY","blueprintIdentifier": "pagerdutyService","mapping": {"identifier": "{{.entity.identifier}}","properties": {"mtbfTarget": "{{.inputs.mtbfTarget}}","mtbfCriticalThreshold": "{{.inputs.criticalThreshold}}","mtbfWarningThreshold": "{{.inputs.warningThreshold}}"}}},"requiredApproval": false} -
Click
Save.
Create MTBF monitoring automation
Set up MTBF monitoring service
Before creating the automation, we need to set up a dedicated PagerDuty service to receive MTBF threshold breach alerts. This ensures all MTBF-related incidents are centrally managed and don't get mixed with incidents from the monitored services themselves.
Create a new PagerDuty service with the following details:
- Name:
MTBF Threshold Monitor. - Description:
Monitors MTBF thresholds across all services and alerts when targets are breached. - Integration Type: Events API v2.
If you need help creating or syncing PagerDuty services, see the PagerDuty integration documentation.
Add routing key to Port secrets
Once you've created your MTBF monitoring service, add its routing key to Port secrets:
-
In your PagerDuty service, go to the Integrations tab and copy the Integration Key (routing key).
-
Open the Credentials modal.
-
Click on the
Secretstab. -
Click on
+ Secretand add the following:- Key:
MONITORING_SVC_PAGERDUTY_ROUTING_KEY. - Value: Your MTBF monitoring service integration key (e.g.,
a1b2c3d4e5f6789012345678901234567890abcd).
- Key:
-
Click
Save.
Create the automation
Set up an automation to monitor MTBF thresholds and trigger alerts:
-
Head to the automation page.
-
Click on the
+ Automationbutton. -
Copy and paste the following JSON configuration:
MTBF threshold monitoring automation (click to expand)
{"identifier": "mtbf_threshold_monitor","title": "MTBF Threshold Monitor","description": "Monitor MTBF values against set thresholds and trigger alerts","trigger": {"type": "automation","event": {"type": "ENTITY_UPDATED","blueprintIdentifier": "pagerdutyService"},"condition": {"type": "JQ","expressions": [".diff.after.properties.mtbf_30_days",".diff.after.properties.mtbfTarget","(.diff.after.properties.mtbf_30_days / .diff.after.properties.mtbfTarget * 100) < .diff.after.properties.mtbfCriticalThreshold"],"combinator": "and"}},"invocationMethod": {"type": "WEBHOOK","url": "https://events.pagerduty.com/v2/enqueue","method": "POST","headers": {"Content-Type": "application/json"},"body": {"routing_key": "{{.secrets.MONITORING_SVC_PAGERDUTY_ROUTING_KEY}}","event_action": "trigger","payload": {"summary": "MTBF Critical Threshold Breached: {{.event.diff.after.title}}","source": "Port MTBF Monitor","severity": "critical","custom_details": {"service": "{{.event.diff.after.title}}","current_mtbf": "{{.event.diff.after.properties.mtbf_30_days}}","target_mtbf": "{{.event.diff.after.properties.mtbfTarget}}","threshold_breached": "Critical"}}}},"publish": true} -
Click
Save.
Visualize MTBF metrics
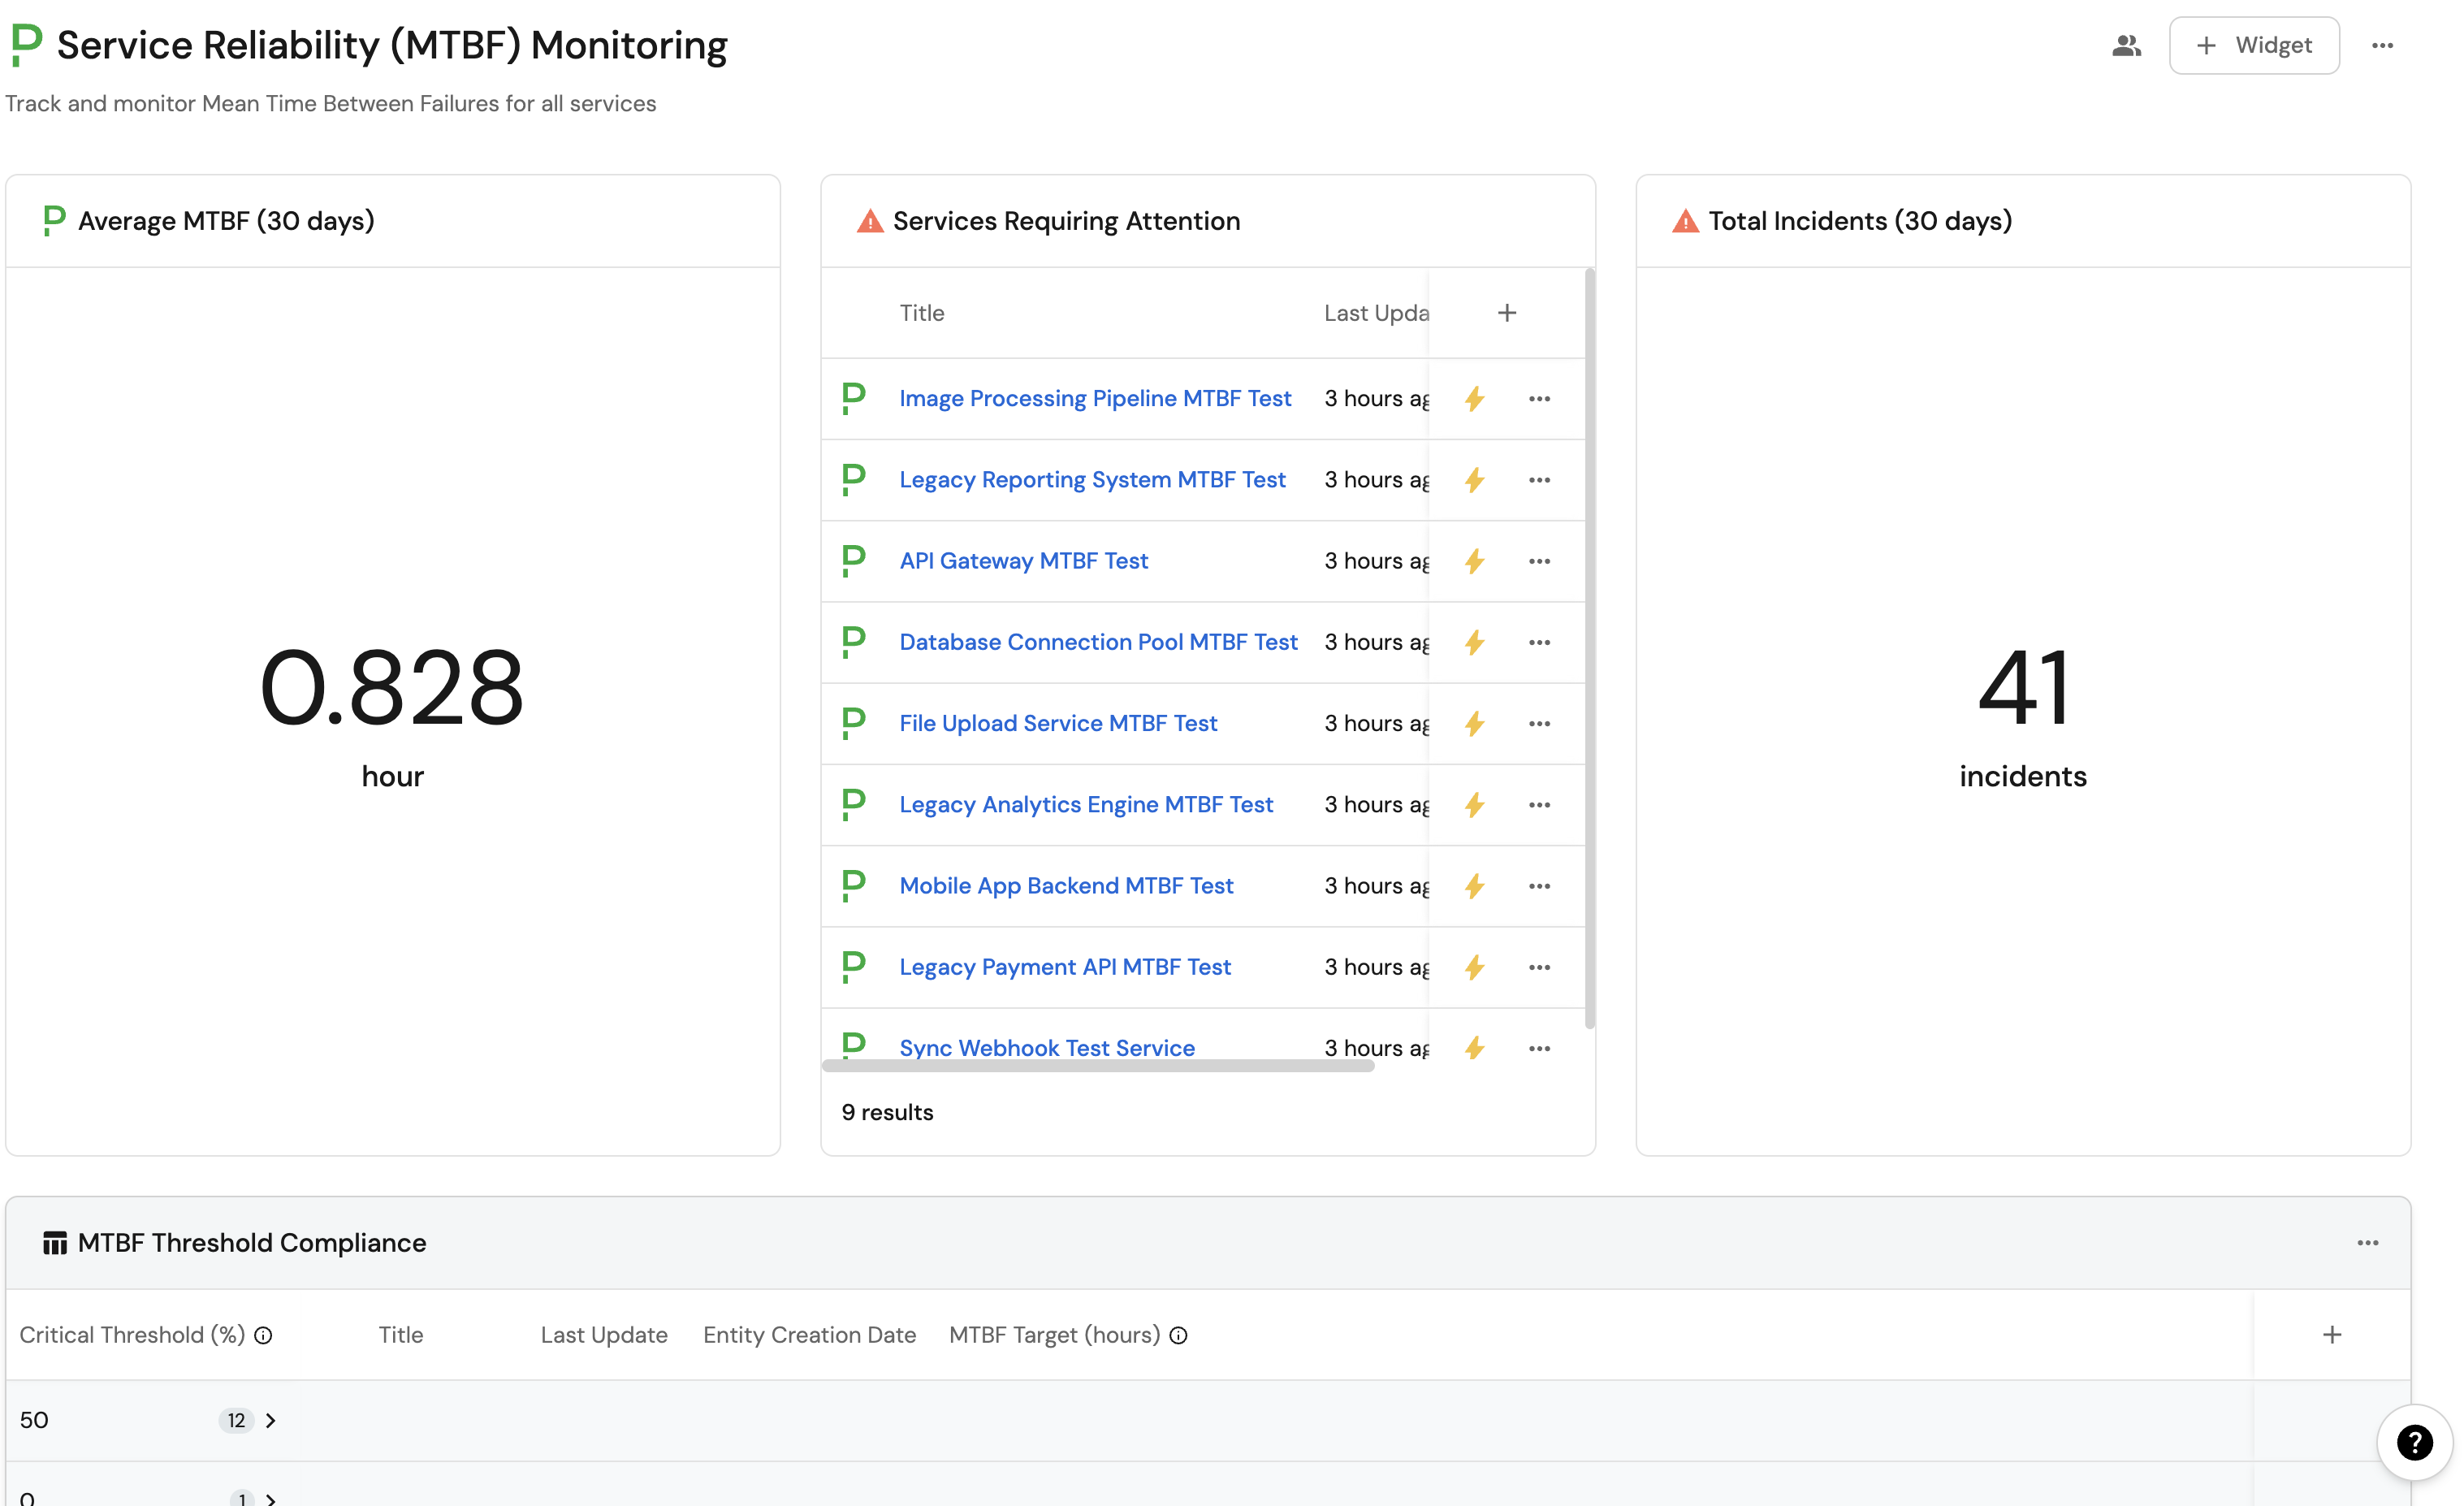
With your MTBF data and monitoring actions in place, you can create a dedicated dashboard in Port to visualize service reliability, track MTBF trends, and quickly identify services that need attention.
Create MTBF dashboard
-
Navigate to your context lake.
-
Click on the
+button in the left sidebar. -
Select New dashboard.
-
Name the dashboard Service Reliability (MTBF) Monitoring.
-
Input
Track and monitor Mean Time Between Failures for all servicesunder Description. -
Select the
pagerdutyicon. -
Click
Create.
Add MTBF widgets
Create the following widgets in your new dashboard:
MTBF overview widget (click to expand)
-
Click
+ Widgetand select Number Chart. -
Title:
Average MTBF (30 days)(add thepagerdutyicon). -
Select
Aggregate by propertychart type and choose PagerDuty Service blueprint. -
Choose
MTBF (30 days)property andaveragefunction. -
Select
Hourfor Average of and set custom unit tohours. -
Click
Save.
Low MTBF services widget (click to expand)
-
Click
+ Widgetand select Table. -
Title:
Services Requiring Attention(add theAlerticon). -
Choose the PagerDuty Service blueprint.
-
Add this filter to show services with low MTBF:
{"combinator": "or","rules": [{"property": "mtbf_30_days","operator": "<","value": 168},{"property": "incidents30Days","operator": ">","value": 5}]} -
Click
Save.
High incident volume services widget (click to expand)
-
Click
+ Widgetand select Number Chart. -
Title:
Total Incidents (30 days)(add theAlerticon). -
Select
Count entitieschart type and choose PagerDuty Service blueprint. -
Choose
Incidents (30 days)property andcountfunction. -
Set Unit of measurement to
customand type incidents. -
Click
Save.
MTBF threshold compliance widget (click to expand)
-
Click
+ Widgetand select Table. -
Title:
MTBF Threshold Compliance(add theTargeticon) -
Choose the PagerDuty Service blueprint.
-
Click on
Save. -
Click on the
...button in the top right corner and chooseCustomize table. -
Group table by
mtbfCriticalThresholdproperty. -
Click on the
Saveicon in the top right corner.
Let's test it!
-
Verify MTBF calculations:
- Navigate to your PagerDuty Service catalog.
- Open any service and check that MTBF values are populated.
- Verify the MTBF trend shows the correct status.
-
Test the Generate MTBF Report action:
- Go to a service with incident history.
- Click
Generate MTBF Report. - Select a time range and execute the action.
- Review the detailed service information returned.
-
Set reliability targets:
- Click
Set MTBF Targeton a critical service. - Set an appropriate target (e.g., 168 hours for weekly failures).
- Configure warning (75%) and critical (50%) thresholds.
- Click
-
Monitor the dashboard:
- Open your Service Reliability (MTBF) Monitoring dashboard.
- Review services requiring attention.
- Check MTBF trends and target compliance.
Best practices
- Set realistic targets: Base MTBF targets on historical performance and business requirements.
- Monitor trends: Focus on trend direction rather than absolute values - improving trends indicate better reliability.
- Investigate degrading services: Services with declining MTBF need immediate attention and investigation.
- Regular review: Schedule weekly reviews of MTBF metrics with engineering teams.
- Combine with MTTR: Use MTBF alongside MTTR metrics for comprehensive reliability monitoring.
Related guides
- Manage and visualize your PagerDuty incidents: Complete incident management with PagerDuty.
- Track SLOs and SLIs for services: Implement comprehensive service level monitoring.
- Acknowledge incident in PagerDuty: Handle incident acknowledgment workflows.
- Resolve an incident in PagerDuty: Manage incident resolution processes.