Triage incidents using external MCP tools
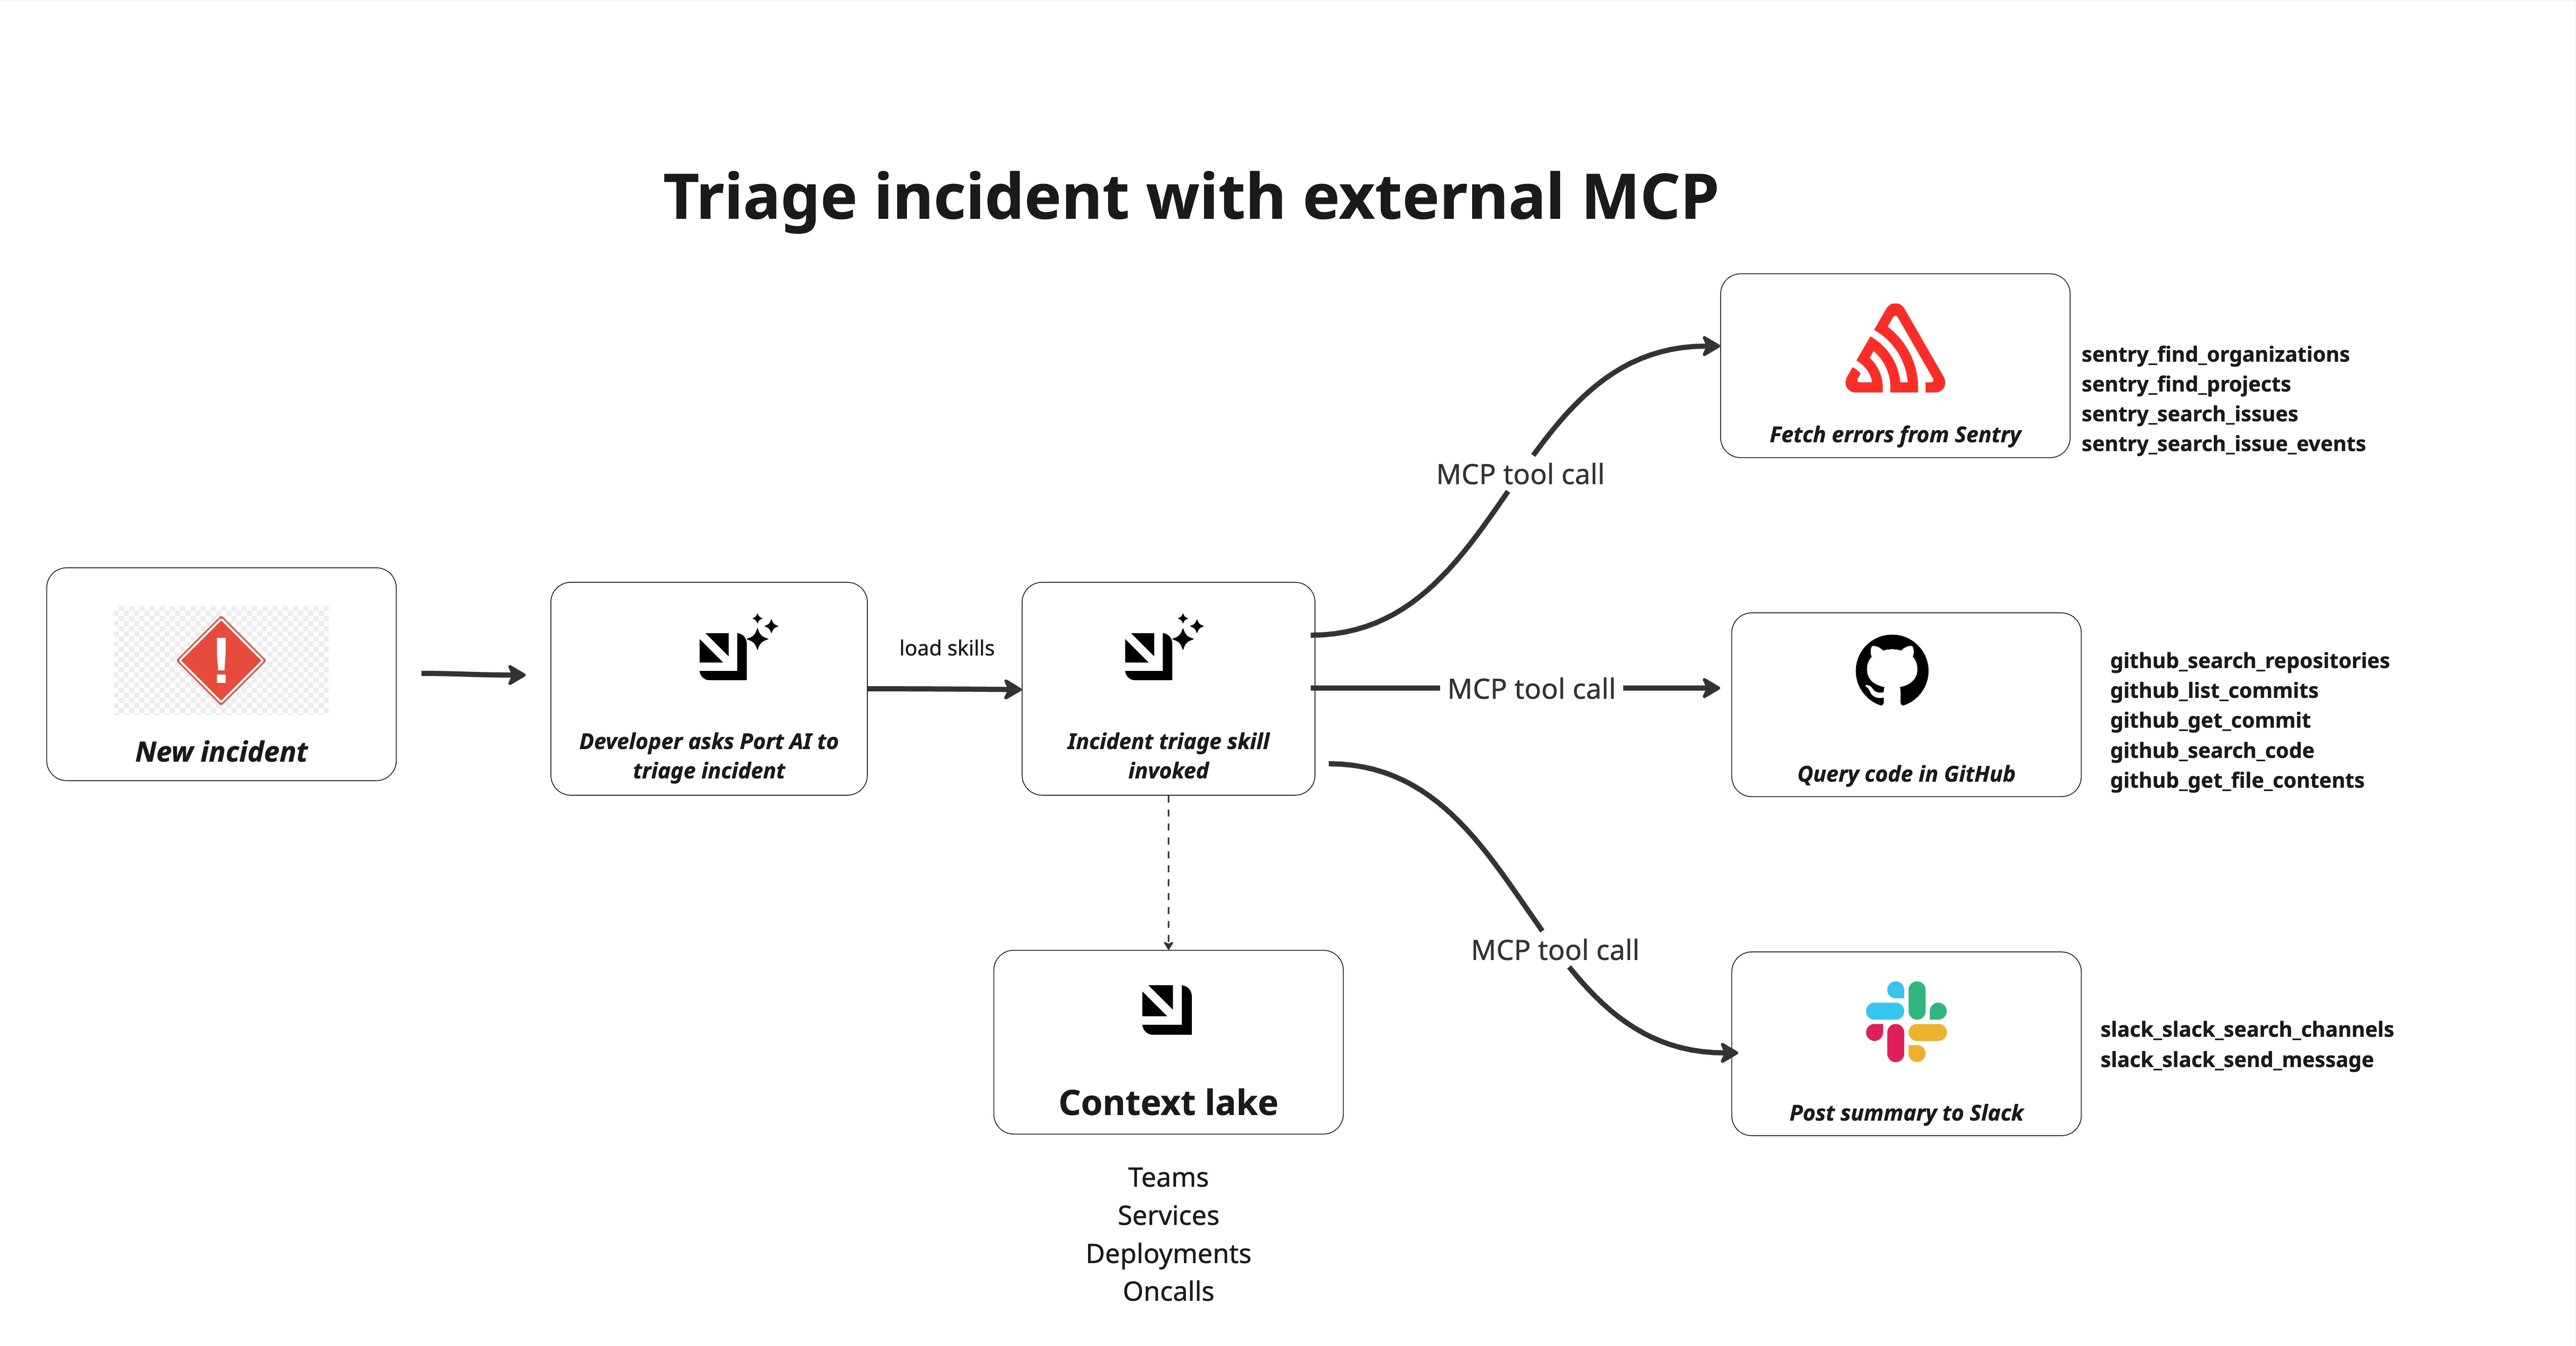
Incident triage requires quickly identifying what broke, why it broke, and who owns it. This guide shows how to use Port AI with connected MCP tools to triage incidents in real time - fetching live errors from Sentry, querying the responsible code in GitHub, synthesising a root-cause hypothesis, and posting a structured summary to Slack. No automation pipelines or AI agents required. Everything runs through the Port AI chat interface, driven by the incident-triage skill.
Common use cases
- First-response triage: Get a structured root-cause summary within minutes of an incident being created, before an engineer has had time to open Sentry.
- Deploy correlation: Automatically cross-reference error spikes with recent commits to identify whether a deployment caused the incident.
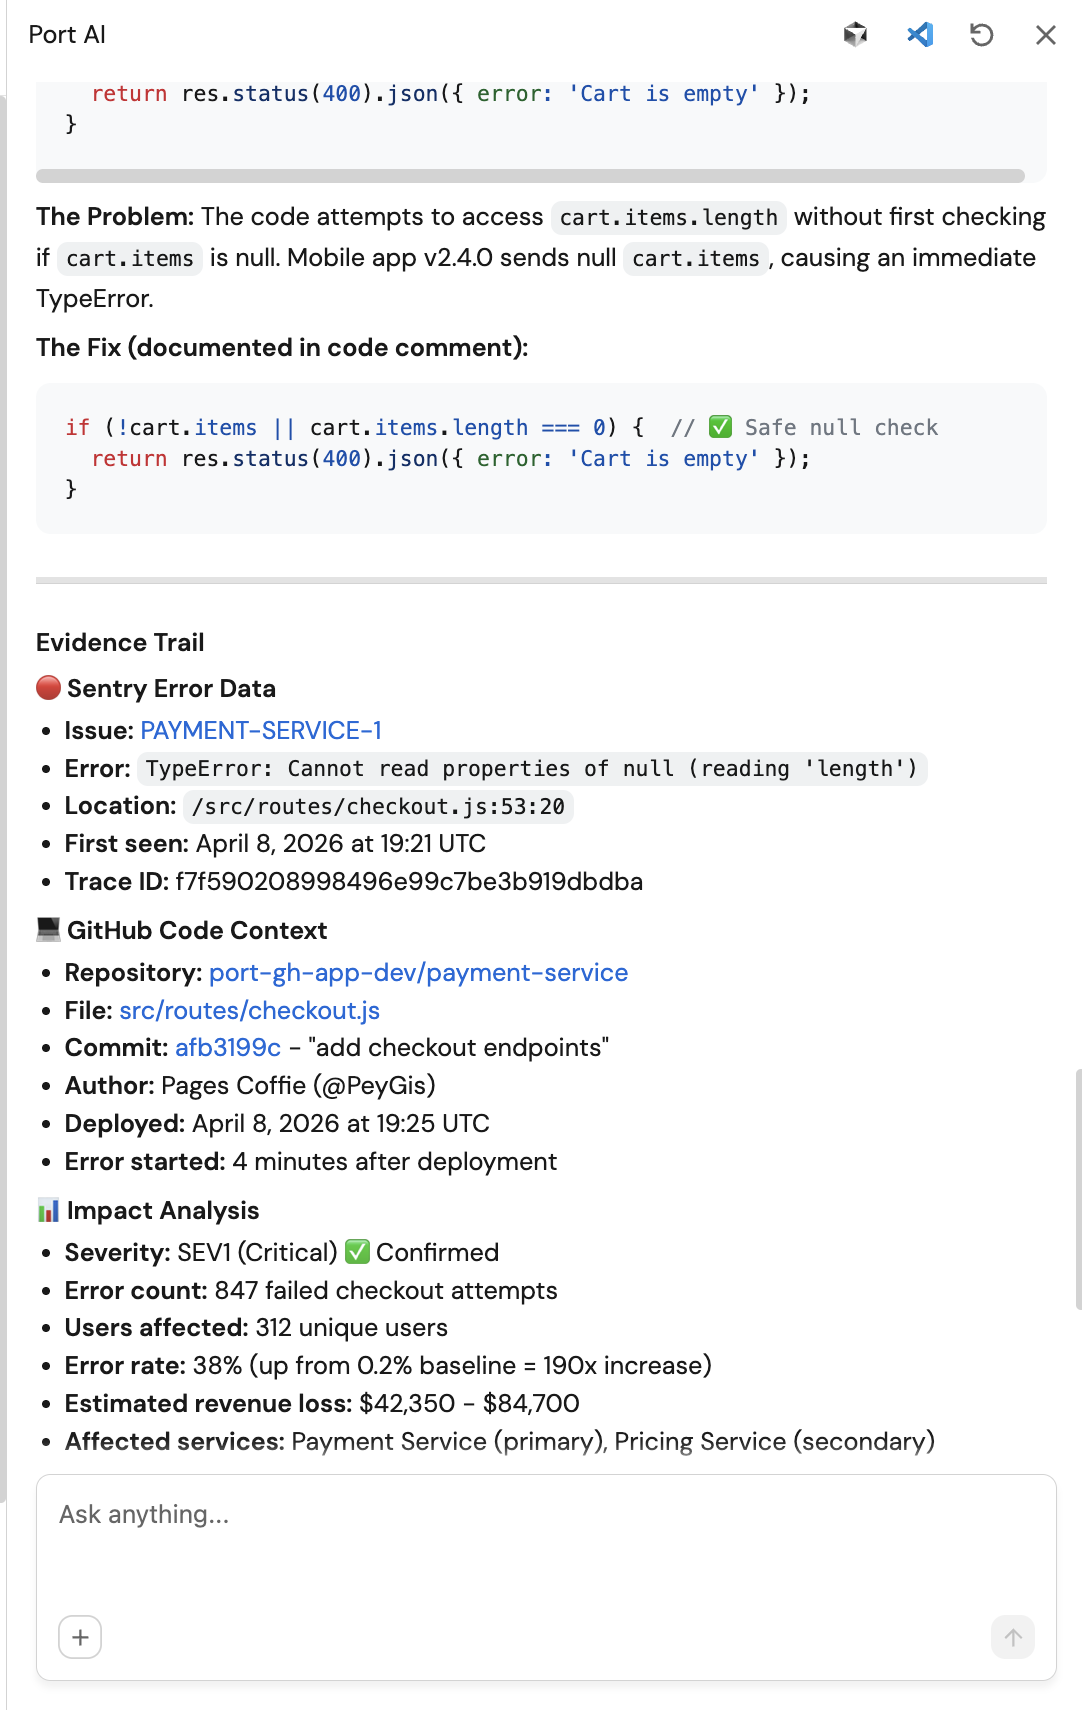
- Code-level diagnosis: Surface the exact file, function, and line number responsible for errors with the relevant code snippet without leaving Port.
Prerequisites
This guide assumes the following:
- You have a Port account with the skills blueprint configured.
- You have implemented the incident blueprint pattern for incident management workflows.
- You have a Sentry project with errors ingested for the affected service.
- You have a GitHub repository containing the source code for the affected service.
- You have access to a Slack workspace.
Set up data model
You will use the incident blueprint pattern described in the incident blueprint guide. The blueprint already includes properties for AI-suggested triage (severity, business impact, communications, owner, response team) and timestamps such as triaged_at.
Connect Sentry, GitHub and Slack MCP
Connect MCP servers through Port's MCP connector gateway. You can learn more in MCP connectors.
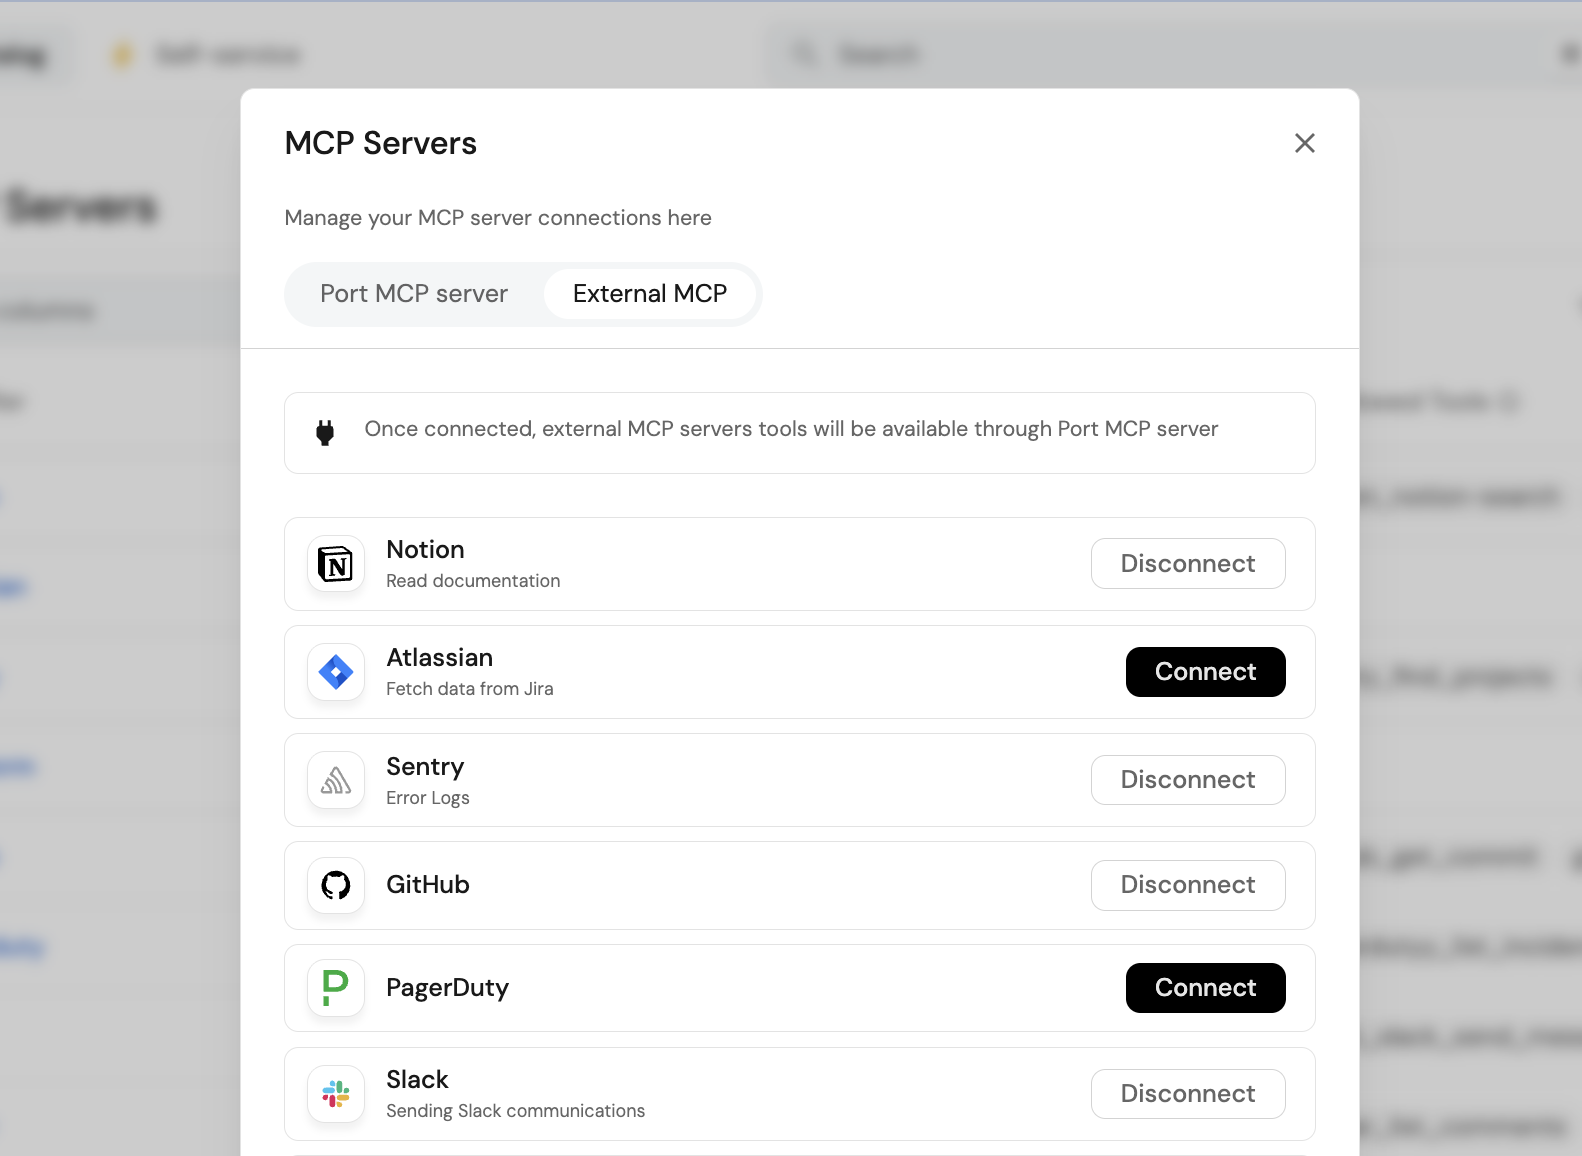
Connect Sentry
- Go to your developer portal in Port.
- Click your avatar in the top-right corner.
- Open MCP Servers.
- Move to the MCP External tab.
- Click Connect for Sentry.
- Complete the authentication flow for your account.
Confirm the following tools are enabled under Sentry's allowed tools:
sentry_find_organizationssentry_find_projectssentry_search_issuessentry_search_eventssentry_search_issue_events
Connect GitHub
- In the same MCP External tab, click Connect for GitHub.
- Complete the OAuth flow.
Confirm the following tools are enabled:
github_search_repositoriesgithub_get_file_contentsgithub_list_commitsgithub_get_commit
Connect Slack
- In the same MCP External tab, click Connect for Slack.
- Complete the OAuth flow.
- Ensure you have enabled
Model Context Protocolin Slack under Agents & AI Apps
Confirm the following tools are enabled:
slack_slack_search_channelsslack_slack_send_message
Create the incident triage skill
Create the skill that Port AI will invoke when you ask it to triage an incident.
-
Go to the Skill catalog page in your portal.
-
Click
+ Skill. -
Toggle JSON Mode.
-
Copy and paste this configuration:
Incident triage skill (click to expand)
{"identifier": "incident-triage","title": "incident-triage","icon": "Alert","team": [],"properties": {"description": "Investigate an active incident end-to-end — pull errors and traces from connected observability platforms, query relevant code and recent commits in GitHub, synthesize a root cause analysis, post a structured summary to Slack, and update the incident entity in Port. Use when an incident fires, when a user asks to triage or investigate an incident, or when someone says \"look into this\", \"what's causing X\", \"root cause\", \"RCA\", or \"what broke\" — even if they don't say the word incident explicitly.","instructions": "---\nname: sre-incident-triage\ndescription: Investigate an active incident end-to-end — pull errors and traces from connected observability platforms, query relevant code and recent commits in GitHub, synthesize a root cause analysis, post a structured summary to Slack, and update the incident entity in Port. Use when an incident fires, when a user asks to triage or investigate an incident, or when someone says \"look into this\", \"what's causing X\", \"root cause\", \"RCA\", or \"what broke\" — even if they don't say the word incident explicitly.\n\n---\n\n# SRE Incident Triage Assistant\n\nUse this skill to run first-response triage on an active incident. You will gather live signals from connected MCP tools, synthesize a root cause hypothesis, and deliver a structured triage to Slack and back to the incident entity in Port.\n\n## Step 1: Identify the Incident\n\nDetermine which incident to triage:\n\n- If triggered by a Port automation, the incident entity identifier and properties will be available in context\n- If invoked manually by a user, ask: \"Which incident should I triage? Please provide the incident name or Port entity identifier.\"\n\nFetch the full incident entity using `list_entities ` on the `incident` blueprint (or whichever blueprint stores incidents) with filters. Extract:\n- **Title** — the incident name\n- **Affected service** — the service identifier or name\n- **Severity** — P1/P2/P3 or equivalent\n- **Created at** — timestamp\n- **Reported by** — user or system that created the entity\n- **Triage summary** — check if already populated; if so, notify the user and ask if they want to re-run triage\n\n## Step 2: Discover Available MCP Tools\n\nBefore fetching any external data, query the `_mcp_server` blueprint to understand what tools are currently connected and approved:\n\n1. Use `list_entities` on `_mcp_server` where `exposed = true`\n2. Build a mental map of available tool categories:\n - **Observability / error tracking** — look for servers with tools matching `list-issues`, `get-issue`, `list-events`, `query-logs` (e.g. Sentry, Datadog, Dynatrace)\n - **Code** — look for servers with tools matching `search_code`, `get_file_contents`, `list_commits` (e.g. GitHub, GitLab)\n - **Incident management** — look for servers with tools matching incident or alert queries (e.g. Sentry, PagerDuty)\n3. Proceed with whatever observability and code tools are available — do not hardcode tool names, use what the catalog tells you is connected\n4. If no observability tool is connected, note this in the triage output and proceed with Port context only\n\n## Step 3: Fetch Observability Data\n\nUsing the observability tools identified in Step 2:\n\n1. **Select the correct organization (critical)**\n\n * Discover available organizations/workspaces using the observability tool\n * If multiple orgs exist make a best choice\n * Record the selected org and use it consistently for all queries.\n\n2. **Project discovery and selection**\n\n * Use the observability tool to list all projects in the selected org\n * Select the project that best matches the **affected service** (exact match first, then closest name/tag match)\n\n3. **Search for issues / errors / logs**\n\n * Query the selected project for recent issues, errors, events, or logs.\n * Prefer the last **72 hours**, ordered by frequency/impact, limit **10**\n * For Sentry, use `sentry_search_issues` (or equivalent) scoped to the discovered org/project\n * For other connected tools, use the equivalent issue/event/log query tools\n\n4. **Fetch details for the top 1–2 signals**\n\n * For the top 1–2 issues/events by event count, fetch full detail\n * Prefer payloads that include stack trace, exception details, tags, and timestamps\n\n5. **Extract and record**\n\n * **Tool/source**\n * **Organization + project selected**\n * **Error type and message**\n * **Frequency** — events in last 1h / 24h (if available)\n * **First seen / last seen**\n * **Top stack frame** — file path, function, line number\n * **Key tags** — environment, release, user impact, host/pod/service\n\n6. **If no errors are found**\n\n * Broaden the search to the last **few days**\n * Retry with looser filters (project-only or service-name keyword)\n * If still nothing is found, note that no strong observability signal was available and continue with GitHub + Port context\n\n## Step 4: Query GitHub for Code Context\n\nUsing the code tools identified in Step 2:\n\n1. **Discover GitHub context first**\n\n * Use the available code tools to discover accessible **organizations / owners** and relevant **repositories**\n * Prefer repositories that match the affected service name, Port metadata, or any repo name/tag found in observability signals\n * Do not assume a default org or repository\n\n2. **Locate the relevant code**\n\n * From the stack trace in Step 3, use the **file path**, **function name**, or **erroring module** to identify the most relevant code location\n * If the exact path is unknown, use `github_search_code` (or equivalent) to search by file name, function name, or error-related symbol\n * If the exact repo is unclear, search across the most likely candidate repositories first\n\n3. **Fetch file contents**\n\n * Use `github_get_file_contents` (or equivalent) to retrieve the relevant file\n * Extract the function or code block around the error location (about **±20 lines** around the referenced line if available)\n\n4. **Check recent changes**\n\n * Use `github_list_commits` (or equivalent) on the relevant file or repository for the last **few days**\n * Prioritize commits touching the same file or function referenced by the stack trace\n * If file-level history is unavailable, fall back to recent repo commits\n\n5. **Extract and record**\n\n * **Repository selected**\n * **File path and function**\n * **Relevant code snippet / behavior summary**\n * **Recent commits** — author, message, timestamp\n * **Any likely cause patterns** — null handling, type mismatch, config change, API contract change, dependency/version update\n\n6. **If no exact code match is found**\n\n * Fall back to the most likely repository for the affected service\n * Search by service name, module name, or recent commits only\n * If still ambiguous, note the gap and continue with Port + observability evidence rather than blocking triage\n\n## Step 5: Gather Port Context Lake Signals\n\nQuery Port's catalog for additional context on the affected service:\n\n1. Use `list_entities` on the service entity to retrieve:\n - **Owning team** and team members\n - **On-call** assignment if modelled as a relation or property\n - **Recent deployments** — check deployment entities related to the service, look for any in the last 24-48 hours\n - **Open GitHub issues** related to the service if ingested\n - **Scorecard status** — is the service already below baseline on any rules?\n2. Cross-reference recent deployments with the first-seen timestamp of the Sentry errors — if a deploy happened just before errors spiked, that is the leading hypothesis\n\n## Step 6: Synthesize the Triage\n\nCombine all signals into a structured triage. Reason through:\n\n1. **Probable root cause** — state your best hypothesis and confidence level (high / medium / low). Be specific: name the file, function, commit, or change that is most likely responsible. If multiple hypotheses exist, rank them.\n2. **Affected component** — which service, module, or dependency is the blast radius\n3. **Severity assessment** — based on error frequency, user impact tags, and service tier — confirm or adjust the reported severity\n4. **Suggested owner** — the on-call engineer or team lead based on the owning team from Port\n5. **Suggested next action** — one concrete action: rollback the deploy, add a null check, investigate the dependency, escalate to the vendor, etc.\n\nFormat the triage as follows (you will use this both for Slack and for writing back to Port):\n\n```\n🚨 INCIDENT TRIAGE — [Incident Title]\n\nSeverity: [P1/P2/P3]\nAffected service: [service name]\nTriggered: [created at timestamp]\n\nPROBABLE ROOT CAUSE\n[1-2 sentences stating the hypothesis with evidence. E.g. \"A null pointer exception in payments/checkout.py line 84 began spiking at 14:32 UTC, 4 minutes after deploy v2.4.1 by @engineer. The commit removed a defensive check on the cart object.\"]\n\nERROR SIGNALS\n• [Error type]: [N] events in last hour — first seen [time]\n• [Error type]: [N] events in last hour — first seen [time]\n\nCODE CONTEXT\nFile: [file path]\nFunction: [function name]\nRecent change: [commit message] by [author] at [timestamp]\n\nSUGGESTED OWNER\n[Team name] — [on-call name if available]\n\nSUGGESTED NEXT ACTION\n[Single concrete action]\n\nLinks: [Sentry issue URL] | [GitHub file URL] | [Port incident entity URL]\n```\n\n## Step 7: Post to Slack\n\nSend the triage summary to the service's configured channel:\n\n1. Use the connected Slack mcp tool `slack_slack_send_message` to post the message to the appropriate channel (using your MCP search channel tool) if no channel is configured on the service entity\n2. Use the full formatted triage block from Step 6 as the message body\n\n## Step 9: Deliver the Response\n\nReport back to the user with:\n- Confirmation that the Slack message was posted (with channel name)\n- Confirmation that the incident entity was updated (with link)\n- A brief version of the triage summary inline in the chat\n- Any gaps: tools that were not available, data that could not be fetched, or signals that were ambiguous\n\n\n## Important Notes\n\n- **Always discover tools dynamically** from `_mcp_server` in Step 2 — never assume Sentry or GitHub are connected. If they are not, state what is missing and triage with available signals only.\n- **Do not wait for perfect data.** If Sentry returns no results, proceed with GitHub and Port context. A partial triage posted quickly is more valuable than a complete triage posted late.\n- **Timestamp everything.** Every signal should include when it was observed — this is critical for correlating deploys with error spikes.\n- **One hypothesis, clearly stated.** Do not hedge with five possible causes. Pick the most likely one based on evidence and state your confidence level. List alternatives only if confidence is low.\n- **The Slack message is the deliverable.** Everything else — GitHub queries, entity updates — supports it. Prioritise getting a useful message to #incidents above all else.\n- **Never include raw stack traces in the Slack message.** Summarise the relevant frame only. Full traces go in the Port entity or a Sentry link.\n"},"relations": {}} -
Click
Registerto add the skill.
Create sample incident entity
Create the incident entity that the skill will triage. You can do this manually for testing or via a webhook from Sentry in production.
-
Go to the Incidents page of your portal.
-
Click on
+ Incident. -
Click on the
JSON Modebutton. -
Use the following JSON:
Sample incident entity (click to expand)
{"identifier": "INC-0042","title": "payments-service — 500 errors spike on POST /checkout","icon": "Alert","properties": {"severity": "sev1","status": "active","description": "Spike in 500 errors on POST /checkout beginning at 14:32 UTC. Error rate went from baseline 0.2% to 38% within 3 minutes. 8 errors recorded.","alert_source": "sentry","alerted_at": "2026-04-06T19:38:00.000Z"},"relations": {"affected_services": ["payment_service","pricing_service"],"primary_service": "payment_service","related_incidents": []}} -
Click Register.
The incident JSON above uses sample services (payment_service and pricing_service) from the service blueprint and a sample alert from Sentry. Update these values to match your own services and alert source.
Test the triage workflow
Run the triage
-
Open the Port AI chat interface.
-
Enter the following prompt:
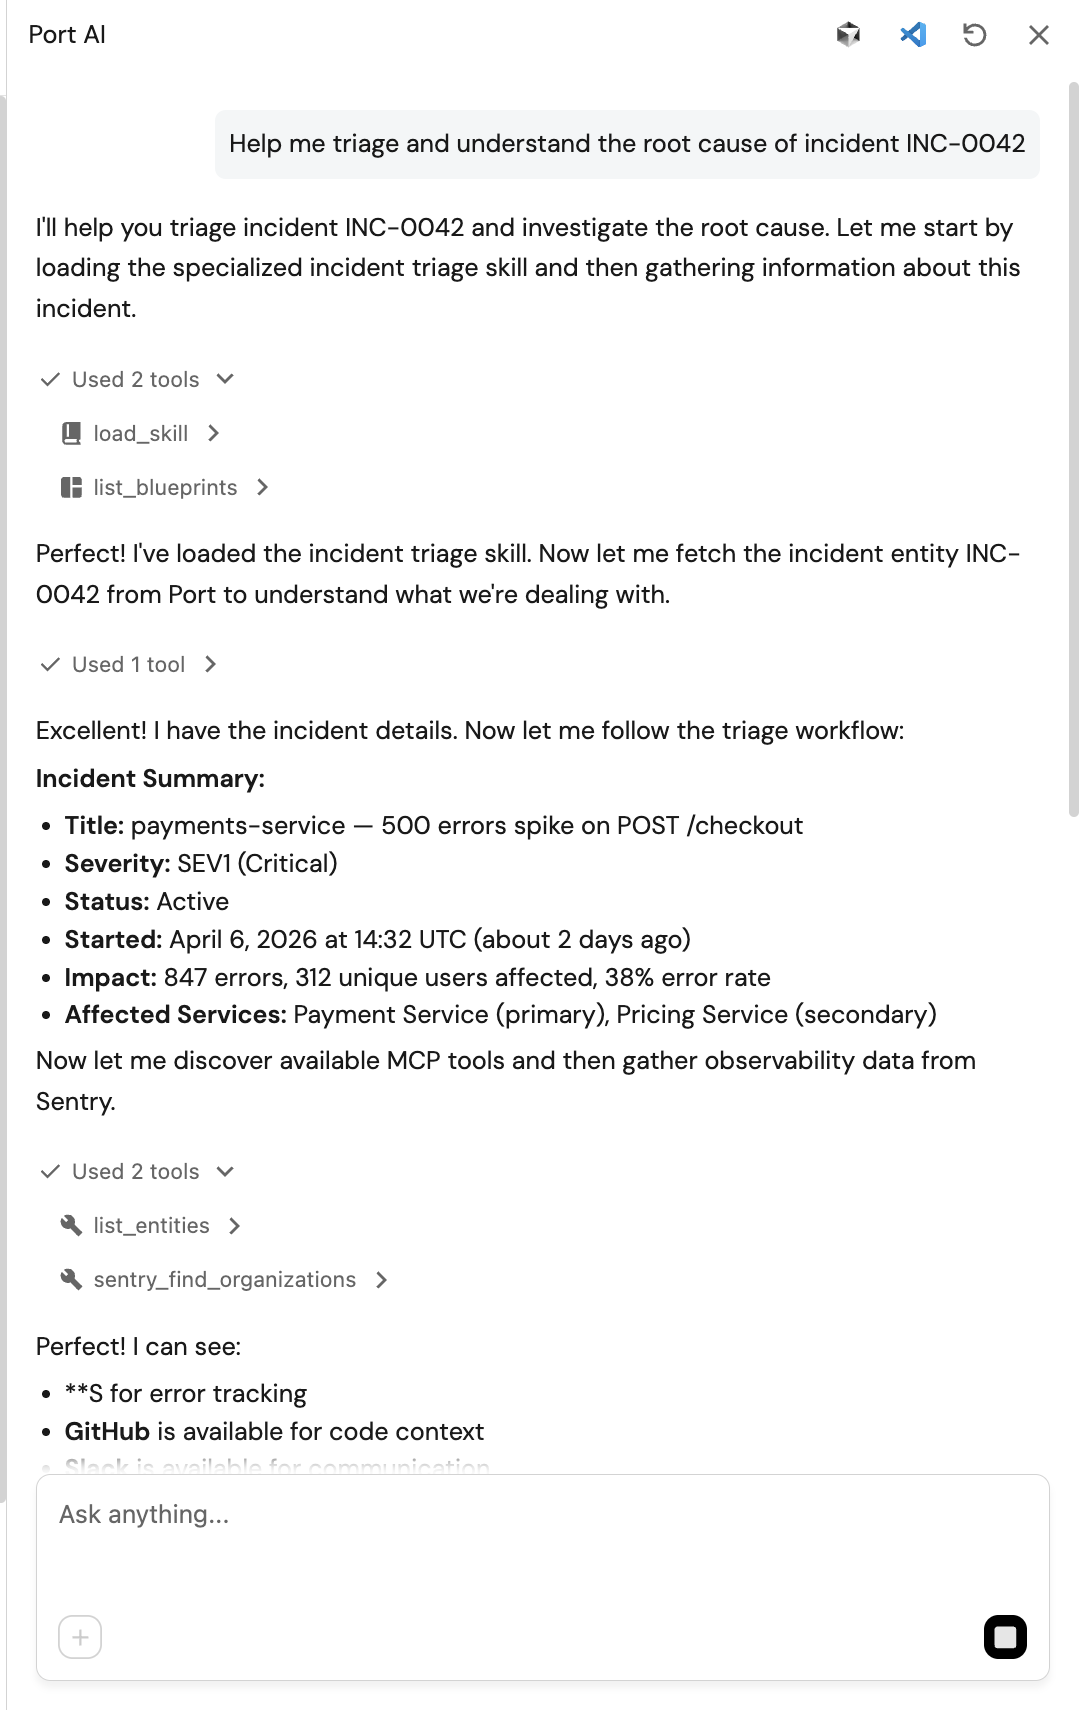
"Help me triage and understand the root cause of incident INC-0042"
-
Watch Port AI automatically load the sre-incident-triage skill and call the connected MCP tools in sequence:
- Queries
_mcp_serverto discover available tools - Calls
sentry_search_issuesto fetch the top errors forpayments-service - Calls
github_search_repositoriesandgithub_get_file_contentsto read the file at the error location - Calls
github_list_commitsto check for recent changes near the error site - Synthesises a root-cause hypothesis combining all signals
- Calls
slack_slack_send_messageto send the slack notification
Sample Port AI interface:
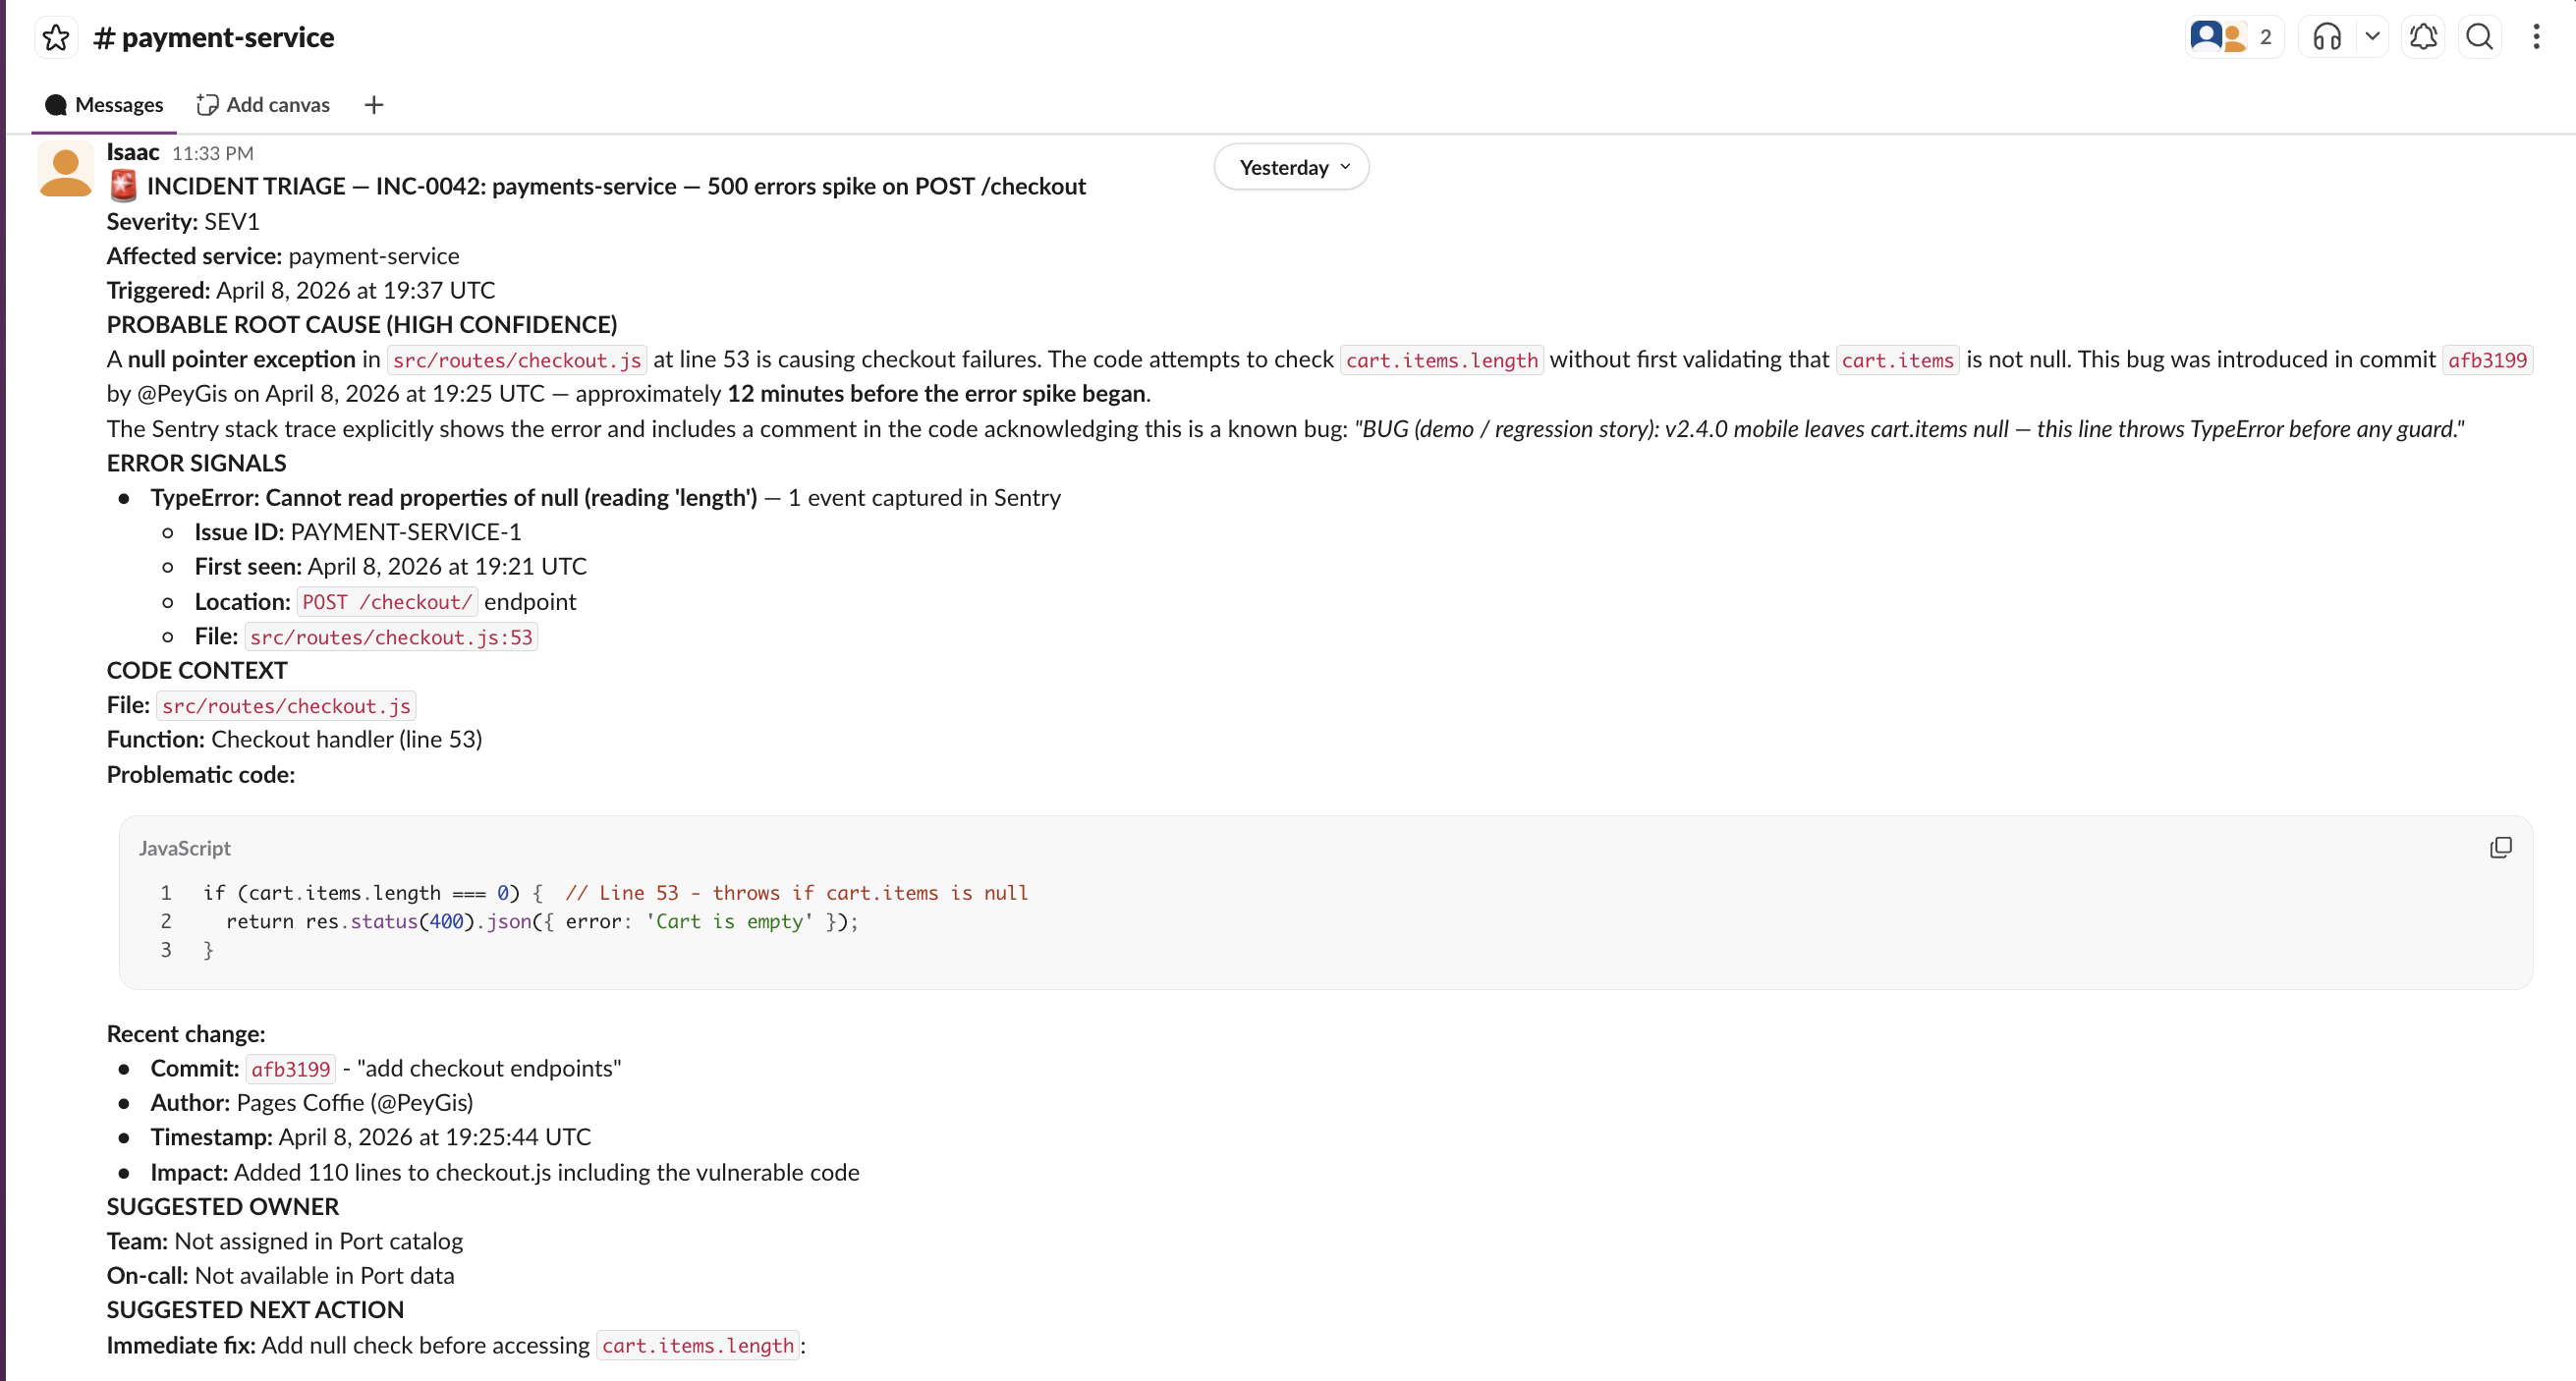
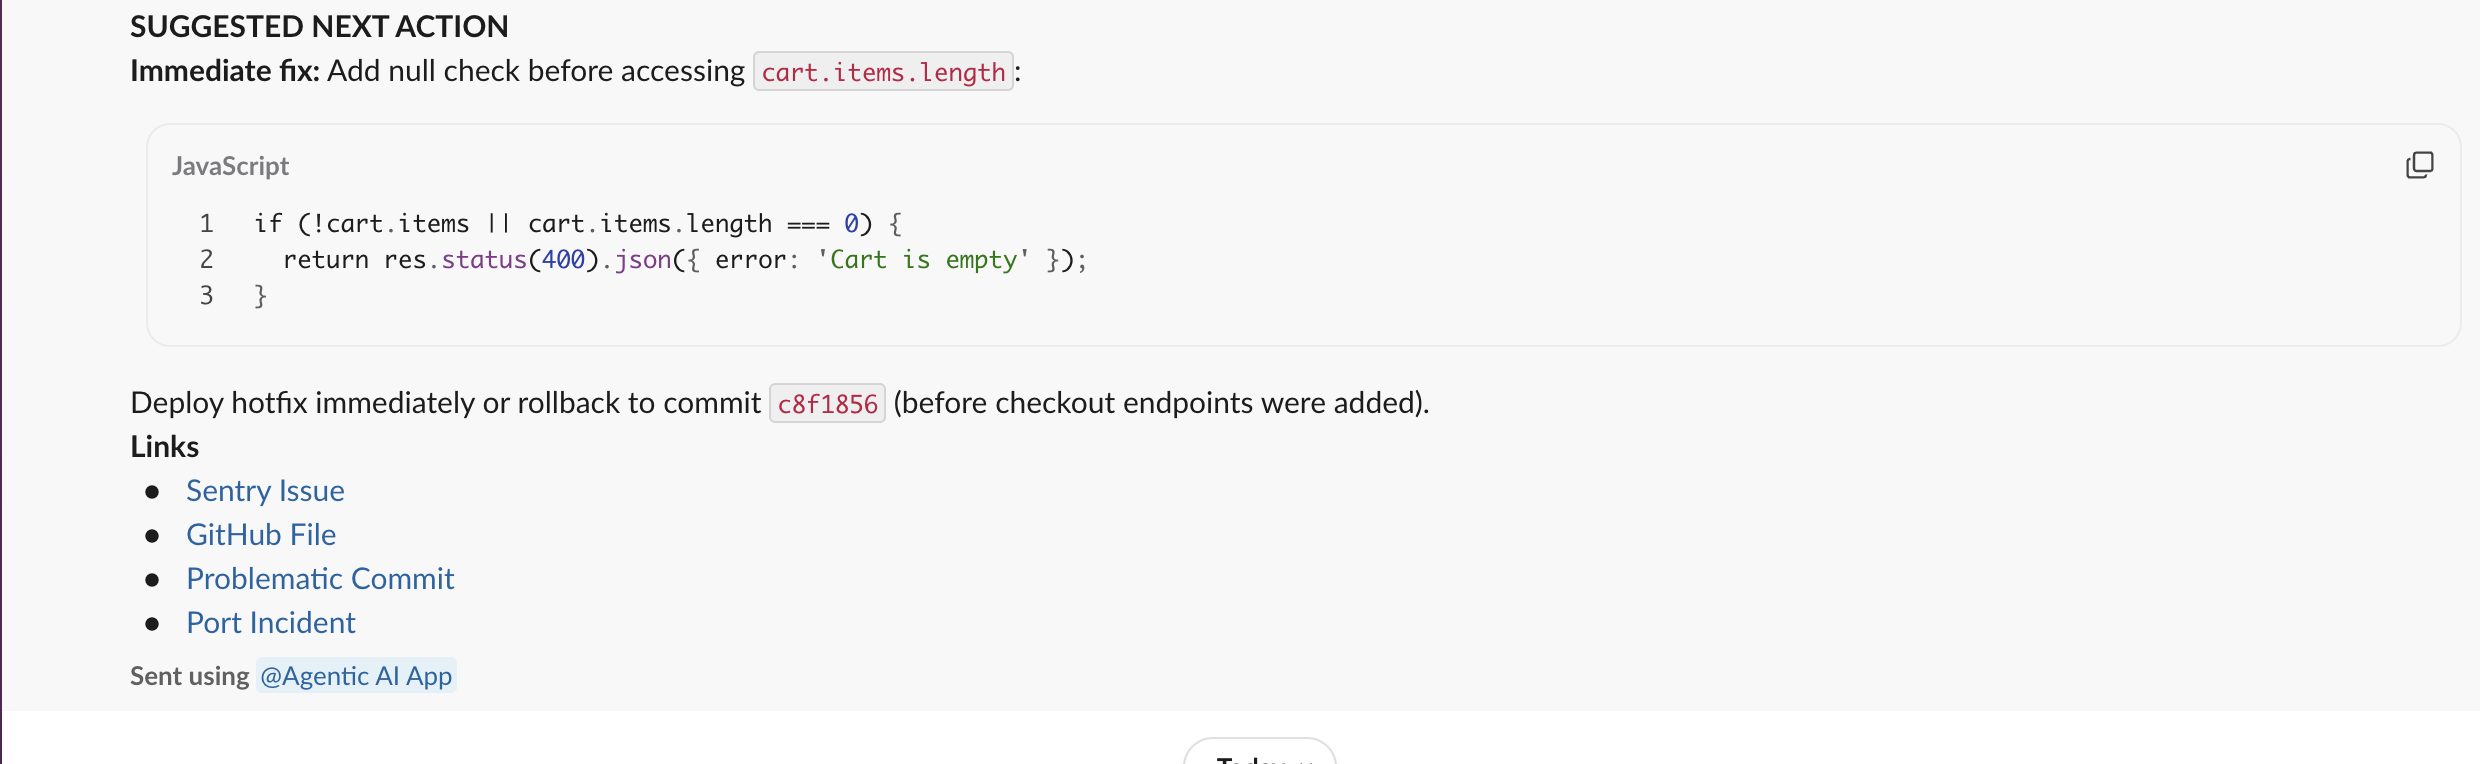
Sample Slack notification:
- Queries
What to check
- The skill discovers Sentry and GitHub tools dynamically from the
_mcp_servercatalog - not hardcoded. - The triage summary names a specific file, function, and commit - not a generic explanation.
- If Sentry or GitHub is not connected, the skill states this clearly and triages with available signals only.
- The Slack message contains links to Sentry and GitHub, not just a text summary.