Visualize Claude Skills adoption and usage
This guide is scoped to Claude Skills data ingested by Port's Claude integration. For token, cost and model-level Claude metrics, see Visualize Claude metrics.
Most organizations adopting skills cannot answer the questions that matter. Are people using skills at all, or did they try once and stop? Are the same skills coming back day after day, or is everyone building throwaway experiments? And is the knowledge staying locked to individuals, or becoming shared?
This guide walks you through building a Claude Skills adoption dashboard in Port. We'll add a small number of calculation properties to the blueprint the Claude integration already creates, then build a dashboard on top of it. The result reads as a single story:
- Adoption: Are skills being used, and by how many different skills?
- Depth: Are people returning to the same skills, or only ever trying new ones?
- Reuse: Is knowledge staying personal, or becoming reusable by teammates?
- Repeatability: Which skills have become part of regular workflows?
- Cost: Where is skill-related spend concentrated?
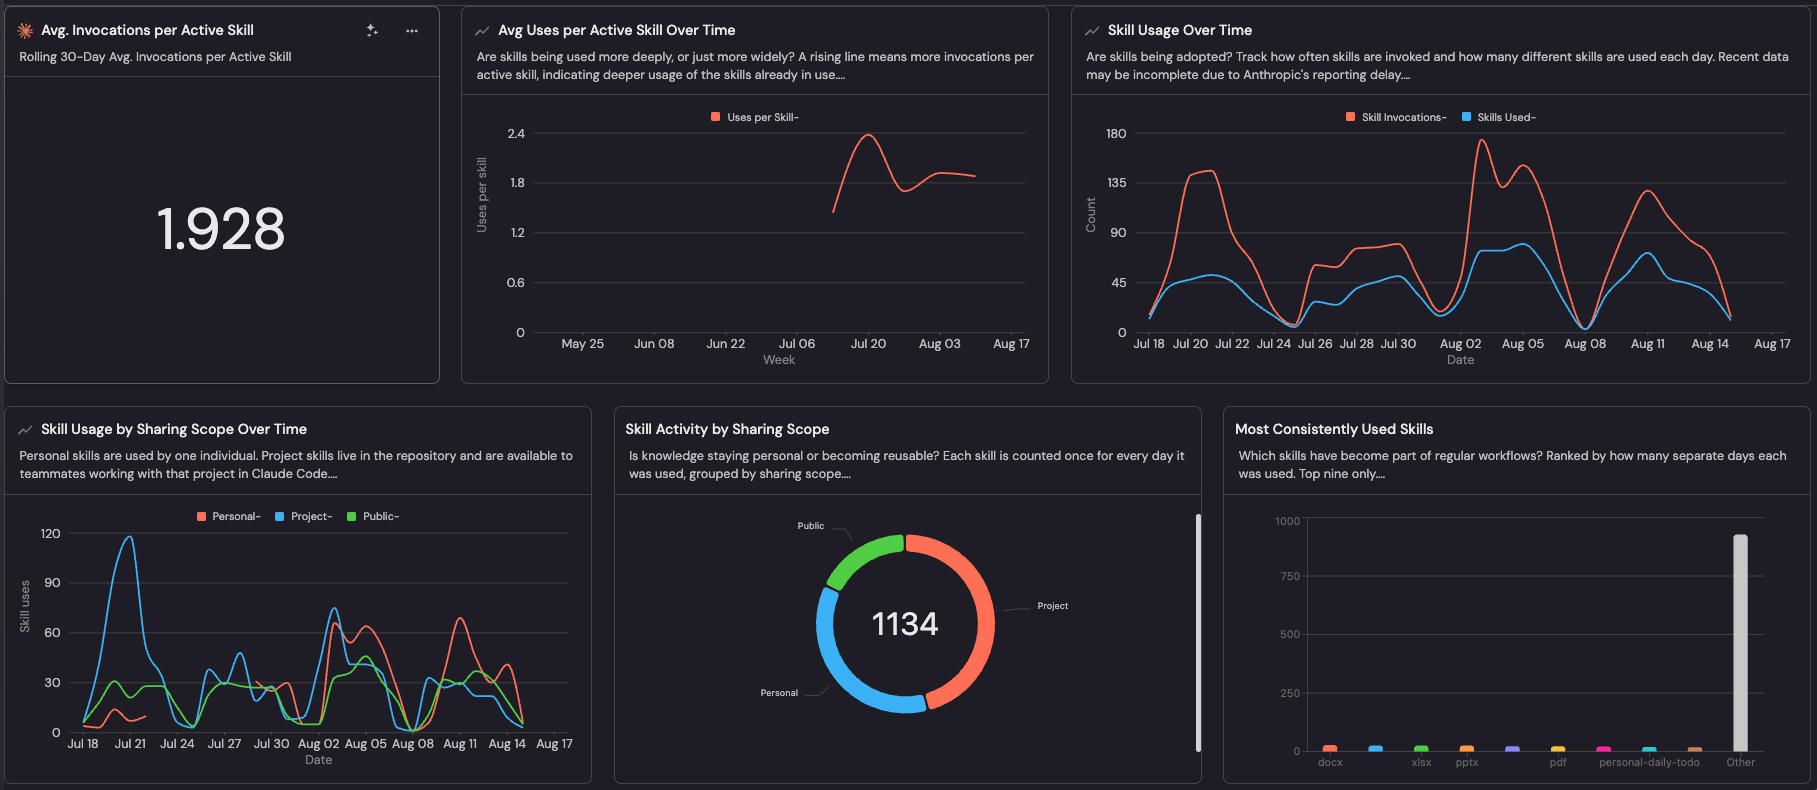
The Claude Skills Adoption & Usage dashboard built in this guide.
Common use cases
- Measure how broadly and deeply Skills are being adopted.
- Understand whether knowledge stays personal or becomes reusable.
- Identify consistently used Skills worth scaling or standardizing.
Prerequisites
This guide assumes the following:
- You have a Port account and have completed the onboarding process.
- Port's Claude integration is installed and ingesting data.
- The
claude_ai_skill_usageblueprint exists (created automatically when you install the Claude integration). - Your organization is on a Claude Enterprise plan, and the API key used by the integration has the
read:analyticsscope. Skill usage analytics are unavailable otherwise.
Understanding Claude skill types
Skills hosted by Anthropic. This covers three different things that all carry a sharing setting: Anthropic's own pre-built skills (docx, pptx, xlsx, pdf), custom skills a user uploads on claude.ai (individual to that user), and custom skills uploaded through the Claude API, which are shared workspace-wide.
Skills stored outside Anthropic (Claude Code). Files under .claude/skills/, either committed to a git repository by your team or kept locally on a developer's machine. Anthropic neither hosts them nor knows who can read them, so they carry no sharing setting at all and the share_status property arrives empty rather than missing. Access is governed by repository and local file permissions.
This produces four groups:
share_status | Type | Who can use it | Where it lives |
|---|---|---|---|
private | Personal | One individual only | Anthropic |
organization | Organization | Everyone in the workspace | Anthropic |
public | Public | Published openly, including Anthropic's pre-built skills (such as docx, pptx, xlsx, pdf) | Anthropic |
| Not applicable | Project | Anyone with repository access, or just the author for local files | Your git repositories and local files |
Names of private skills are not disclosed, so they appear as opaque identifiers such as skill_01Kd8iFQ… rather than readable names.
Project skills can be measured through the Claude integration without being registered in Port. Teams can later promote proven skills into the Port Skill Registry for centralized discovery and management.
Key metrics overview
The table below is a starting point rather than an exhaustive list. Add or drop metrics to match the questions your organization actually wants answered. Each record in the claude_ai_skill_usage blueprint represents one skill on one day, referred to below as a skill-day.
| Metric | What it measures | Why it matters |
|---|---|---|
| Skill invocations | Total times skills were invoked per day | Headline volume signal for adoption |
| Skills used | How many different skills were used per day | Breadth of adoption |
| Avg. invocations per active skill | Invocations divided by skills used | Separates depth from breadth: is usage deepening or just spreading? |
| Usage by sharing scope | Invocations split into Personal, Project, Public | Whether knowledge is staying individual or becoming reusable |
| Skill activity by sharing scope | Skill-days grouped by scope | Overall distribution behind the trend |
| Days active per skill | Separate days each skill was used | Distinguishes habitual tools from one-off experiments |
| Activity by spend range | Skill-days bucketed by cost band | Where skill-related consumption concentrates |
Avg. invocations per active skill is the one number that tells you whether an adoption programme is maturing. If invocations and skills-used rise together, people are trying more things. If invocations rise while skills-used stays flat, people are returning to skills that work. The second is what durable adoption looks like.
Set up data model
Add calculation properties
- Navigate to your Data model page in Port.
- Find and expand the Claude AI Skill Usage (
claude_ai_skill_usage) blueprint. - Click the
...button in the top right corner, then Edit JSON. - Merge the following into the blueprint's
calculationPropertiesobject, then click Save.
Additional calculation properties (click to expand)
{
  "sharing_scope": {
    "title": "Sharing Scope",
    "icon": "TwoUsers",
    "type": "string",
    "description": "Personal = one individual. Organization = shared organization-wide in Claude.ai. Public = published openly, including Anthropic built-ins. Project = stored outside Claude.ai and used via Claude Code, where no Claude.ai sharing setting exists.",
    "calculation": "if (.properties.share_status == \"private\") then \"Personal\" elif (.properties.share_status == \"organization\") then \"Organization\" elif (.properties.share_status == \"public\") then \"Public\" else \"Project\" end"
  },
  "spend_band": {
    "title": "Spend Range",
    "icon": "DefaultProperty",
    "type": "string",
    "description": "Attributed list price for the skill-day, bucketed so it can be charted as a distribution.",
    "calculation": "if (.properties.attributed_list_price // 0) >= 5 then \"Over $5\" elif (.properties.attributed_list_price // 0) >= 1 then \"$1 to $5\" elif (.properties.attributed_list_price // 0) >= 0.1 then \"$0.10 to $1\" else \"Under $0.10\" end"
  },
  "uses": {
    "title": "",
    "icon": "DefaultProperty",
    "type": "number",
    "description": "Alias of invocation count with a blank title, so chart legends read as the line name alone.",
    "calculation": ".properties.invocation_count // 0"
  },
  "skill_row": {
    "title": "",
    "icon": "DefaultProperty",
    "type": "number",
    "description": "Always 1. Summing it over a time bucket counts the distinct skills used in that bucket.",
    "calculation": "1"
  }
}
Reference blueprint
The block below is the full blueprint after adding the four calculation properties above, so you can diff it against your own. The schema section reflects what the Claude integration creates automatically; only calculationProperties needs to be added by hand.
Full reference blueprint (click to expand)
{
  "identifier": "claude_ai_skill_usage",
  "description": "Org-level Claude skill usage metrics for a single day",
  "title": "Claude AI Skill Usage",
  "icon": "Claude",
  "schema": {
    "properties": {
      "record_date": { "type": "string", "format": "date-time", "title": "Record Date (UTC)" },
      "skill_name": { "type": "string", "title": "Skill Name" },
      "skill_display_name": { "type": "string", "title": "Skill Display Name" },
      "distinct_user_count": { "type": "number", "title": "Distinct Users" },
      "enable_count": { "type": "number", "title": "Enable Count" },
      "invocation_count": { "type": "number", "title": "Invocation Count" },
      "share_status": { "type": "string", "title": "Share Status" },
      "currency": { "type": "string", "title": "Currency" },
      "estimated_overage_spend": { "type": "number", "title": "Estimated Overage Spend" },
      "attributed_list_price": { "type": "number", "title": "Attributed List Price" },
      "chat_conversation_skill_used_count": { "type": "number", "title": "Chat Conversation Skill Uses" },
      "code_session_skill_used_count": { "type": "number", "title": "Claude Code Session Skill Uses" },
      "cowork_session_skill_used_count": { "type": "number", "title": "Cowork Session Skill Uses" },
      "excel_session_skill_used_count": { "type": "number", "title": "Excel Session Skill Uses" },
      "powerpoint_session_skill_used_count": { "type": "number", "title": "PowerPoint Session Skill Uses" },
      "word_session_skill_used_count": { "type": "number", "title": "Word Session Skill Uses" },
      "outlook_session_skill_used_count": { "type": "number", "title": "Outlook Session Skill Uses" }
    },
    "required": ["record_date", "skill_name"]
  },
  "mirrorProperties": {},
  "calculationProperties": {
    "sharing_scope": {
      "title": "Sharing Scope",
      "icon": "TwoUsers",
      "description": "Personal = one individual. Organization = shared organization-wide in Claude.ai. Public = published openly, including Anthropic built-ins. Project = stored outside Claude.ai and used via Claude Code, where no Claude.ai sharing setting exists.",
      "calculation": "if (.properties.share_status == \"private\") then \"Personal\" elif (.properties.share_status == \"organization\") then \"Organization\" elif (.properties.share_status == \"public\") then \"Public\" else \"Project\" end",
      "type": "string"
    },
    "spend_band": {
      "title": "Spend Range",
      "icon": "DefaultProperty",
      "description": "Attributed list price for the skill-day, bucketed so it can be charted as a distribution.",
      "calculation": "if (.properties.attributed_list_price // 0) >= 5 then \"Over $5\" elif (.properties.attributed_list_price // 0) >= 1 then \"$1 to $5\" elif (.properties.attributed_list_price // 0) >= 0.1 then \"$0.10 to $1\" else \"Under $0.10\" end",
      "type": "string"
    },
    "uses": {
      "title": "",
      "icon": "DefaultProperty",
      "description": "Alias of invocation count with a blank title, so chart legends read as the line name alone.",
      "calculation": ".properties.invocation_count // 0",
      "type": "number"
    },
    "skill_row": {
      "title": "",
      "icon": "DefaultProperty",
      "description": "Always 1. Summing it over a time bucket counts the distinct skills used in that bucket.",
      "calculation": "1",
      "type": "number"
    }
  },
  "aggregationProperties": {},
  "relations": {}
}
Visualize metrics
We will create a dashboard that reads top to bottom as one narrative: adoption, then depth, then reuse, then repeatability, then cost.
Create the dashboard
- Navigate to your context lake.
- Click on the
+ Newbutton in the left sidebar. - Select New dashboard.
- Name the dashboard Claude Skills Adoption & Usage, give it the Claude icon, and click Create.
Add widgets
You can populate the dashboard using either an API script or by manually creating each widget through the UI.
- API script
- Manual setup
The fastest way to set up the dashboard is by using Port's API to create all widgets at once.
Get your Port API token
-
Open the Credentials modal.
-
Click Generate API token.
-
Copy the generated token and store it as an environment variable:
export PORT_ACCESS_TOKEN="YOUR_GENERATED_TOKEN"
If Port is hosted in the EU region, replace api.port.io with api.port-eu.io in the dashboard creation command below.
Create the dashboard with widgets
Save the following JSON to a file named claude_skills_dashboard.json:Dashboard JSON payload (click to expand)
Then run the following command to create the dashboard with all widgets:
curl -s -X POST "https://api.port.io/v1/pages" \
  -H "Authorization: Bearer $PORT_ACCESS_TOKEN" \
  -H "Content-Type: application/json" \
  -d @claude_skills_dashboard.json | python3 -m json.tool
Adoption and depth
Start with the top row: one headline number and two trends. Because each record is one skill on one day, dividing the summed invocations by the number of records gives invocations per active skill. Weekly buckets smooth the daily noise. Because this is an average rather than a sum, partial weeks at either end of the range are not distorted. Reading the two together is the point. Rising in lockstep means adoption is spreading across more skills; invocations rising while skills used stays flat means people are going deeper into skills they already have.Avg. invocations per active skill (click to expand)
+ Widget and select Number Chart.Avg. Invocations per Active Skill.Rolling 30-Day Avg. Invocations per Active Skill.Aggregate by property Chart type and choose Claude AI Skill Usage as the Blueprint.Invocation Count (invocation_count) as the Property.average and Average of to total.none.Custom with 1 decimal place.Average of: total produces a single pooled ratio rather than an average of daily averages, which would distort the result.Avg uses per active skill over time (click to expand)
+ Widget and select Line Chart.Avg Uses per Active Skill Over Time.Are skills being used more deeply, or just more widely? A rising line means more invocations per active skill, indicating deeper usage of the skills already in use.Week, Y axis title to Uses per skill.Week and Time range to Last 3 months.Uses per Skill, type Aggregate property, blueprint Claude AI Skill Usage, property uses, function average, measure time by record_date.Skill usage over time (click to expand)
+ Widget and select Line Chart.Skill Usage Over Time.Are skills being adopted? Track how often skills are invoked and how many different skills are used each day. Recent data may be incomplete due to Anthropic's reporting delay.Date, Y axis title to Count, Time interval to Day, Time range to Last month.Skill Invocations, type Aggregate property, blueprint Claude AI Skill Usage, property uses, function sum, measure time by record_date.Skills Used, type Aggregate property, same blueprint, property skill_row, function sum, measure time by record_date.
Reuse
Skill usage by sharing scope over time (click to expand)
-
Click
+ Widgetand select Line Chart. -
Title:
Skill Usage by Sharing Scope Over Time. -
Description:
Personal skills are used by one individual. Project skills live in the repository and are available to teammates working with that project in Claude Code. -
Set X axis title to
Date, Y axis title toSkill uses, Time interval toDay, Time range toLast month. -
Add three lines, each of type
Aggregate propertyon the Claude AI Skill Usage blueprint, propertyuses, functionsum, measure time byrecord_date, differing only in their filter:Line title Initial filters Personal{"combinator": "and", "rules": [{"property": "share_status", "operator": "=", "value": "private"}]}Project{"combinator": "and", "rules": [{"property": "share_status", "operator": "isEmpty"}]}Public{"combinator": "and", "rules": [{"property": "share_status", "operator": "=", "value": "public"}]} -
Click Save.
Skill activity by sharing scope (click to expand)
- Click
+ Widgetand select Pie Chart. - Title:
Skill Activity by Sharing Scope. - Description:
Is knowledge staying personal or becoming reusable? Each skill is counted once for every day it was used, grouped by sharing scope. - Choose the Claude AI Skill Usage blueprint.
- Select
Sharing Scope(sharing_scope) as the Breakdown by property. - Click Save.
Note the unit. A pie chart counts entities, so each slice is a number of skill-days, not invocations. The trend chart above it sums invocations. Keeping the titles distinct avoids implying the two measure the same thing.
Repeatability
Most consistently used skills (click to expand)
- Click
+ Widgetand select Bar Chart. - Title:
Most Consistently Used Skills. - Description:
Which skills have become part of regular workflows? Ranked by how many separate days each was used. Top nine only. - Choose the Claude AI Skill Usage blueprint.
- Select
Skill Name(skill_name) as the Breakdown by property. - Click Save.
Each bar counts the number of separate days that skill was used, so a skill used a little every day ranks above one used heavily on a single day. That is what distinguishes a habit from an experiment.
Cost
Skill activity by spend range (click to expand)
- Click
+ Widgetand select Bar Chart. - Title:
Skill Activity by Spend Range. - Description:
Which skills are most often associated with higher spend? Each bar is the number of high-spend days, meaning days where requests involving that skill exceeded $5 at list price. Not the skill's own incremental cost. - Choose the Claude AI Skill Usage blueprint.
- Select
Spend Range(spend_band) as the Breakdown by property. - Click Save.
Clicking any bar drills into the skill-days behind it, which is how you find the individual skills sitting in the highest band.
Next steps
Once your dashboard is in place, consider this next step:
- Promote proven project skills into the Port Skill Registry so they can be centrally managed, synced from Git, and discovered across the organization.