Example journey
Engineering intelligence isn't a one-time project, it's a continuous improvement cycle. Most organizations don't start with perfect data or a fully instrumented platform. This page walks through a typical journey, showing how teams progressively improve their engineering effectiveness using Port.
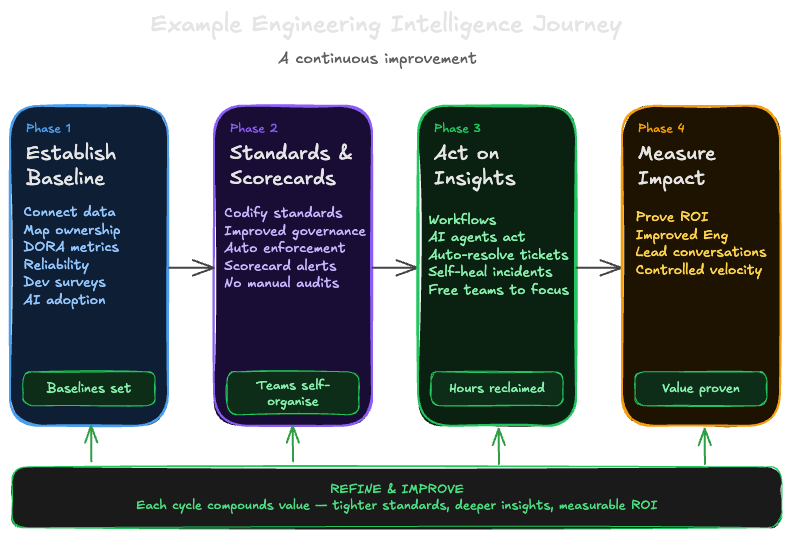
The journey follows four phases, each building on the last. You don't need to complete one phase before starting the next but the sequence reflects what tends to deliver the most value, fastest.
Phase 1: Establish a baseline
The problem: You don't have reliable quantitative data yet. The platform is fragmented, ownership is unclear, and it's hard to know where to focus.
The approach: Start with a developer survey to surface qualitative pain points immediately. In parallel, connect Port to your version control system (such as GitHub, GitLab, or Azure DevOps) and establish your first metrics such as DORA metrics, PR delivery metrics, and pipeline reliability. MCP connectors can also surface qualitative insights from tools like Slack or Jira to help you understand what's slowing teams down beyond what metrics alone can tell you. Even rough baselines give engineering leaders an objective starting point for conversations with stakeholders.
Key outcomes:
- Data ingested using integrations
- Developer pain points identified and prioritized
- Service and team ownership mapped in the software catalog & context lake
- First DORA and delivery performance baselines established
Where to start:
- Integrations & MCP connectors
- DevEx Surveys
- PR Delivery Metrics
- DORA Metrics
- AI Adoption
- Pipeline Reliability (optional)
Phase 2: Standards and scorecards
The problem: You have baseline data, but improvement depends on individuals noticing dashboards and manually following up. Without codified standards, there's no shared understanding of what "great" looks like.
The approach: Connect insights to action with scorecards. Define what "great" looks like and let Port continuously evaluate every service and team against those standards. Scorecards can grade services on areas such as production readiness, but also grade teams on metrics such as DORA performance, delivery performance, and pipeline reliability. When a scorecard drops, Port automatically notifies the owning team and creates a ticket. Stale PRs trigger Slack reminders without anyone having to chase.
Common scorecard examples include:
- Production readiness (ownership, documentation, on-call rotation)
- Delivery performance (PR cycle time, stale PRs)
- Pipeline reliability (CI/CD success rates, failure trends)
- DORA performance (deployment frequency, lead time, CFR, MTTR)
These are starting points, Port's scorecard framework is flexible enough to codify any standard specific to your organization, from security compliance to custom working agreements.
With scorecards in place, standards are checked continuously, no more quarterly audits or manual follow-ups.
Key outcomes:
- Scorecard degradations trigger automatic notifications and tickets
- Production readiness, delivery, and reliability standards enforced continuously
- Teams self-organize around visible gaps without manual policing
Where to start:
Phase 3: Act on insights
The problem: You have data and standards, but turning insights into action still requires manual effort — someone needs to spot the trend, decide what to do, and follow through.
The approach: Use engineering intelligence to drive decisions and action for both human and automated workflows. Combine quantitative data (metrics, scorecards, dashboards) with qualitative data (developer surveys, Slack signals via MCP connectors) to get the full picture. Engineering leaders use these combined insights to identify where to invest, reallocate resources, or change processes. Teams use scorecard data and survey feedback to prioritize their own improvements.
Self-service actions, automations, and workflows help teams act on insights without waiting for manual intervention such as triggering deployments, creating tickets, or notifying owners when scorecards degrade. AI agents and agentic workflows can take it further, for example, autonomous ticket resolution to improve lead time by automatically resolving well-defined tickets, or self-healing incidents to reduce MTTR by autonomously triaging and resolving production issues. AI agents can also enrich PRs with risk signals, self-heal scorecard violations, and handle repetitive context-gathering freeing teams from manual work while keeping humans in control.
Key outcomes:
- Engineering leaders making data-driven decisions on team investments and priorities
- Teams self-organizing around scorecard gaps and delivery bottlenecks
- Agentic workflows improving metrics such as lead time and MTTR
- AI agents handling repetitive context-gathering and triage work
- Engineering hours saved through automation and agentic workflows
- Measurable ROI from AI adoption and process improvements
- Faster feedback loops from insight to action
Where to start:
Phase 4: Measure the impact
The problem: You have baselines, standards, AI agents, and automation in place but you need to demonstrate the business value of these investments, including the impact of AI adoption, and explain why metrics are moving.
The approach: Correlate data across tools to measure real impact. Connect additional tools such as Jira for sprint velocity, PagerDuty for incident trends, or observability tools like Datadog and New Relic for SLOs and correlate them with your existing metrics. Track AI tool adoption (such as GitHub Copilot, Claude, or Cursor) and correlate adoption data with your delivery metrics to measure ROI. Measure the impact of agentic workflows how much time autonomous ticket resolution is saving, how much MTTR has improved with self-healing incidents, and how many engineering hours are being reclaimed from repetitive work. This is where engineering intelligence becomes a business conversation: proving that investments in tooling, standards, automation, and agentic workflows are delivering measurable outcomes.
Key outcomes:
- AI tool adoption measured and correlated with delivery improvements
- Agentic workflow ROI quantified (hours saved, MTTR reduction, lead time improvement)
- Cross-tool insights showing business impact of engineering investments
- Data-driven ROI conversations with leadership
Where to start:
The continuous improvement loop
These phases aren't a linear path you complete once, engineering intelligence is a cycle:
Establish a baseline → Govern and enforce → Act on insights → Measure the impact → Repeat
Each pass tightens the loop. Survey results validate whether metric improvements are actually felt by developers. New metrics reveal previously invisible bottlenecks. Automation frees up capacity to tackle the next layer of improvement.
You don't need to instrument everything before you start. Connect one data source, set up one scorecard, and share the results with your team. Visible progress builds momentum for the next phase.