DORA metrics
Why it matters
DORA metrics are the industry standard for measuring software delivery performance. Without them, engineering leaders rely on gut feeling to assess whether teams are shipping fast enough, safely enough, and recovering quickly enough. Tracking DORA gives you an objective baseline and a common language for improvement conversations across the organization.
But measuring metrics is only the first step — knowing your deployment frequency or change failure rate doesn't tell you whether it's good enough. DORA scorecards turn raw metrics into graded maturity levels, making it clear which teams are Elite, High, Medium, or Low performers and where to focus improvement efforts.
Measure DORA metrics
Port connects deployment, incident, and PR data from your existing tools into a unified software catalog & context lake. Each DORA metric is calculated per service and rolled up to team and organization level so you don't just see aggregate numbers, you see exactly which services and teams are driving the trends. Dashboards update in real time as new deployments and incidents flow in.
Example scenario
An engineering VP wants to benchmark delivery performance before a platform investment. They connect GitHub and PagerDuty to Port and within a day have DORA baselines for every team. The data reveals that while deployment frequency is healthy across most teams, one group has a change failure rate of 25% three times the org average. This becomes the first improvement target, with measurable before-and-after tracking built in.
Example dashboard
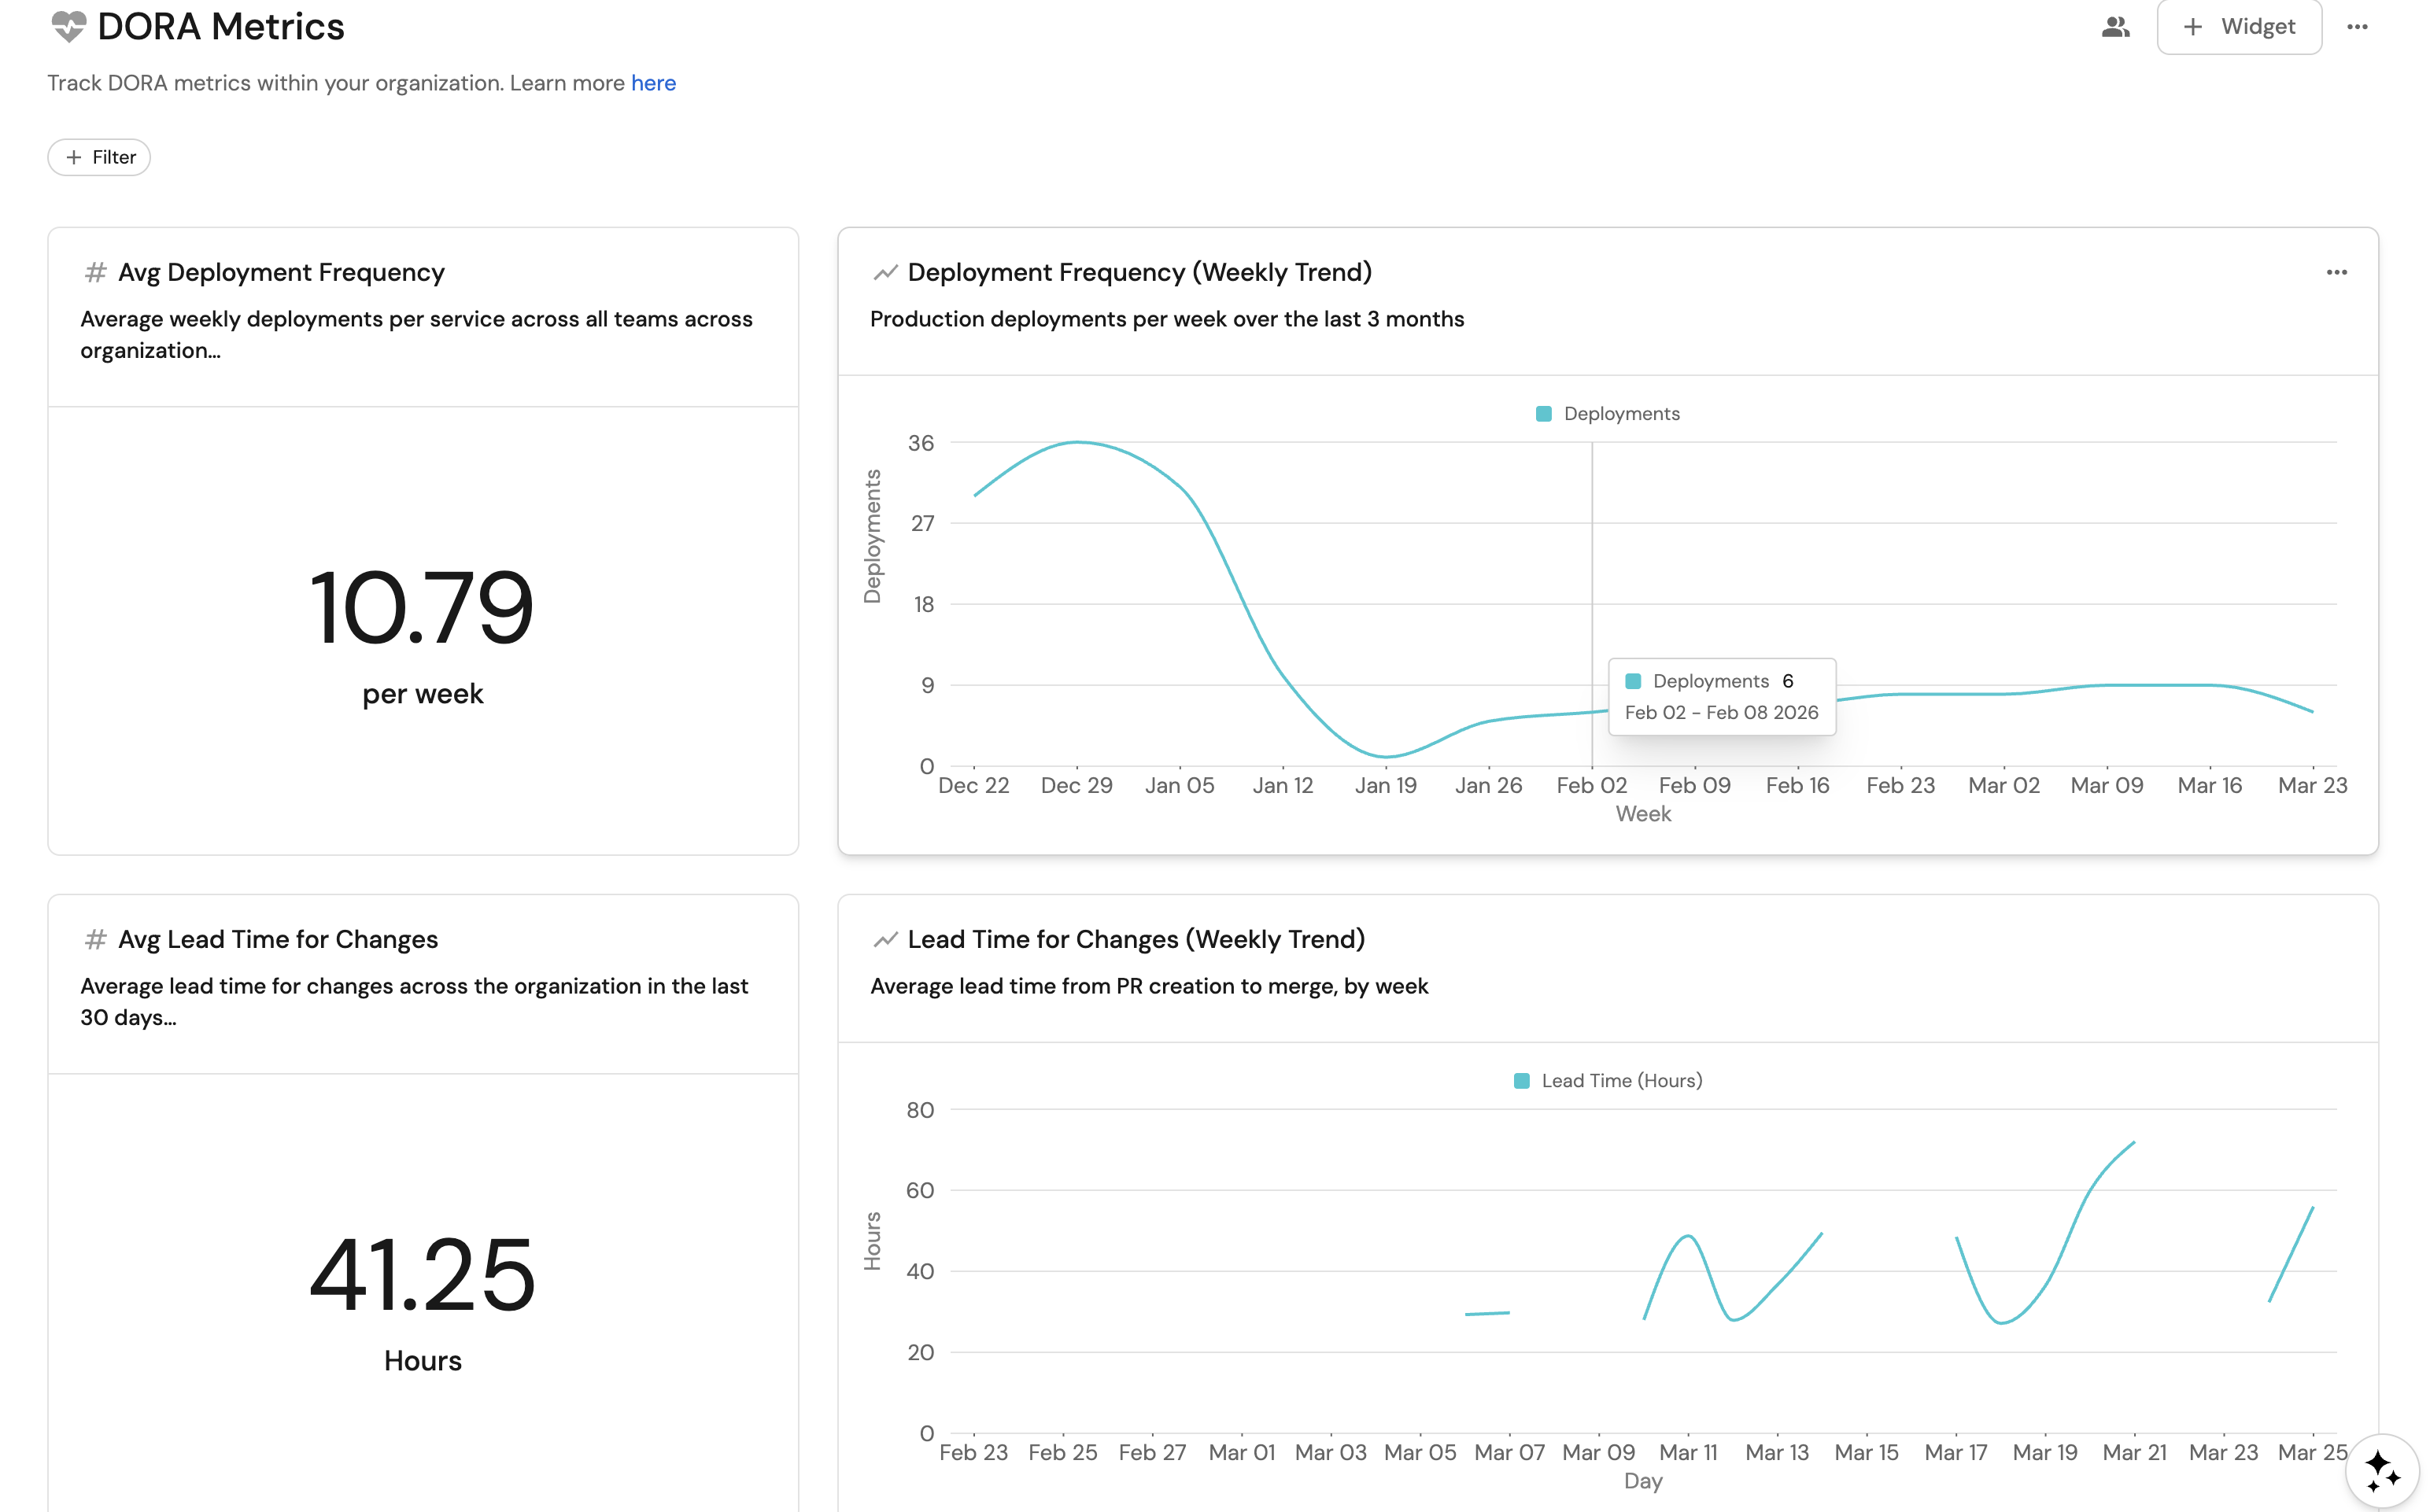
Example DORA metrics dashboard based on Setup DORA metrics guide.
DORA scorecards
Port's DORA scorecards evaluate every service and team against the four DORA metrics using Bronze, Silver, and Gold maturity levels. Scores update in real time as deployment, PR, and incident data flows in from your integrations. Each metric maps to a scorecard rule with configurable thresholds so you can start with industry benchmarks and adjust to your organization's targets. Dashboards show compliance across teams, making it easy to identify which groups need support and which are setting the standard.
Example scenario
A Director of Engineering wants to move all teams from "Medium" to "High" DORA performance within two quarters. They set up DORA scorecards in Port with thresholds aligned to the DORA research benchmarks: Gold requires daily deployments, lead time under one day, CFR below 5%, and MTTR under one hour. The initial scorecard shows 3 of 12 teams at Gold, 5 at Silver, and 4 at Bronze. Teams with Bronze scores drill into their scorecards to see which specific metrics are dragging them down two teams discover their lead time is inflated by long review cycles, while another finds their CFR is high due to missing integration tests. Each team targets their weakest metric, and within 8 weeks, Bronze teams drop to one.
Example dashboard
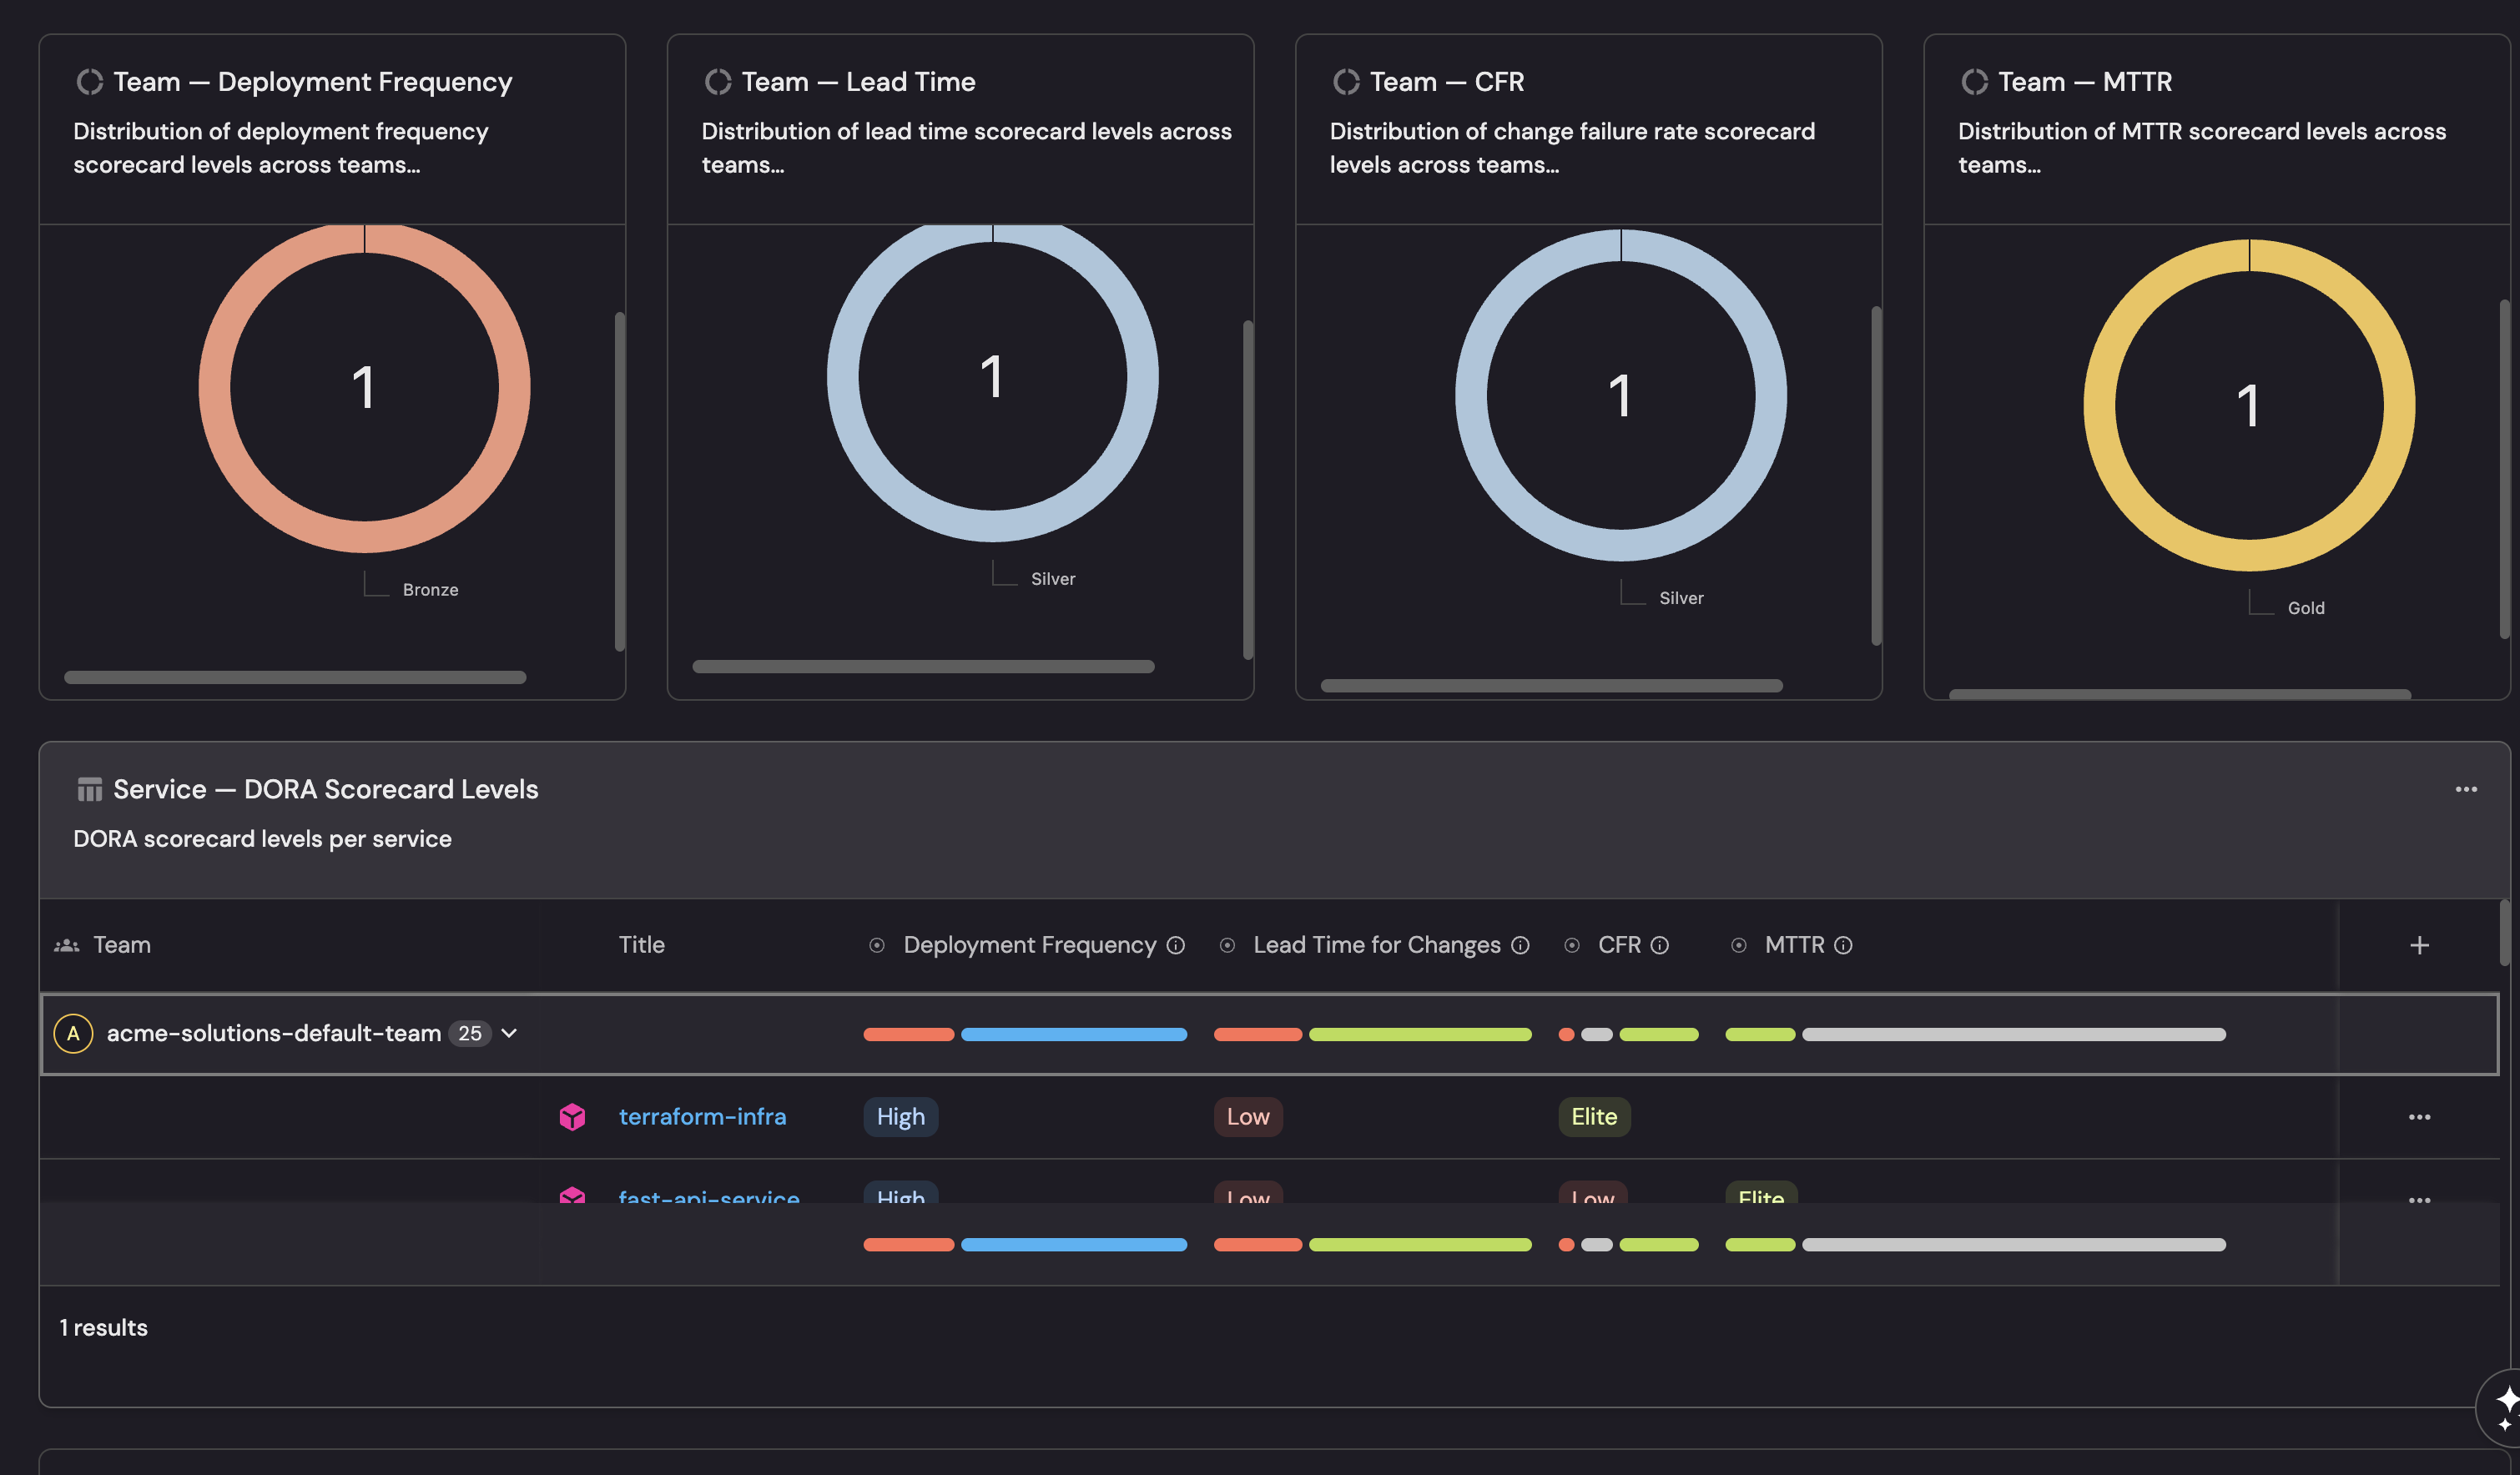
Example DORA scorecards dashboard based on Setup DORA metrics guide.
Follow the recommended guides below to implement this use case.