AI impact
Why it matters
AI tools are being adopted across the engineering organization, but measuring their real impact requires more than tracking usage numbers. The true question is whether AI adoption is improving engineering outcomes in areas like faster delivery, fewer incidents, and better quality. Answering this requires correlating AI usage data with delivery metrics, incident data, and other signals from across your toolchain.
How Port helps
Port brings context from different tools like Jira, GitHub, PagerDuty, observability platforms, and AI coding tools into a single context lake, making it possible to correlate data that normally lives in silos. By linking AI adoption metrics with delivery performance, incident frequency, and code quality data, you can measure the actual impact of AI tools on engineering outcomes. Dashboards show whether teams with higher AI adoption are delivering faster, experiencing fewer incidents, and producing higher-quality code or not.
Example scenario
An engineering VP wants to understand whether AI coding tools are actually improving delivery outcomes. Port correlates Copilot usage data with PR cycle times from GitHub, incident data from PagerDuty, and sprint velocity from Jira. The analysis reveals that teams with high AI adoption have 20% shorter PR cycle times and 15% fewer post-deployment incidents but only for teams that also have strong test coverage. Teams with low test coverage see no improvement, giving the VP a clear signal to invest in test infrastructure before expanding AI tooling further.
Example dashboard
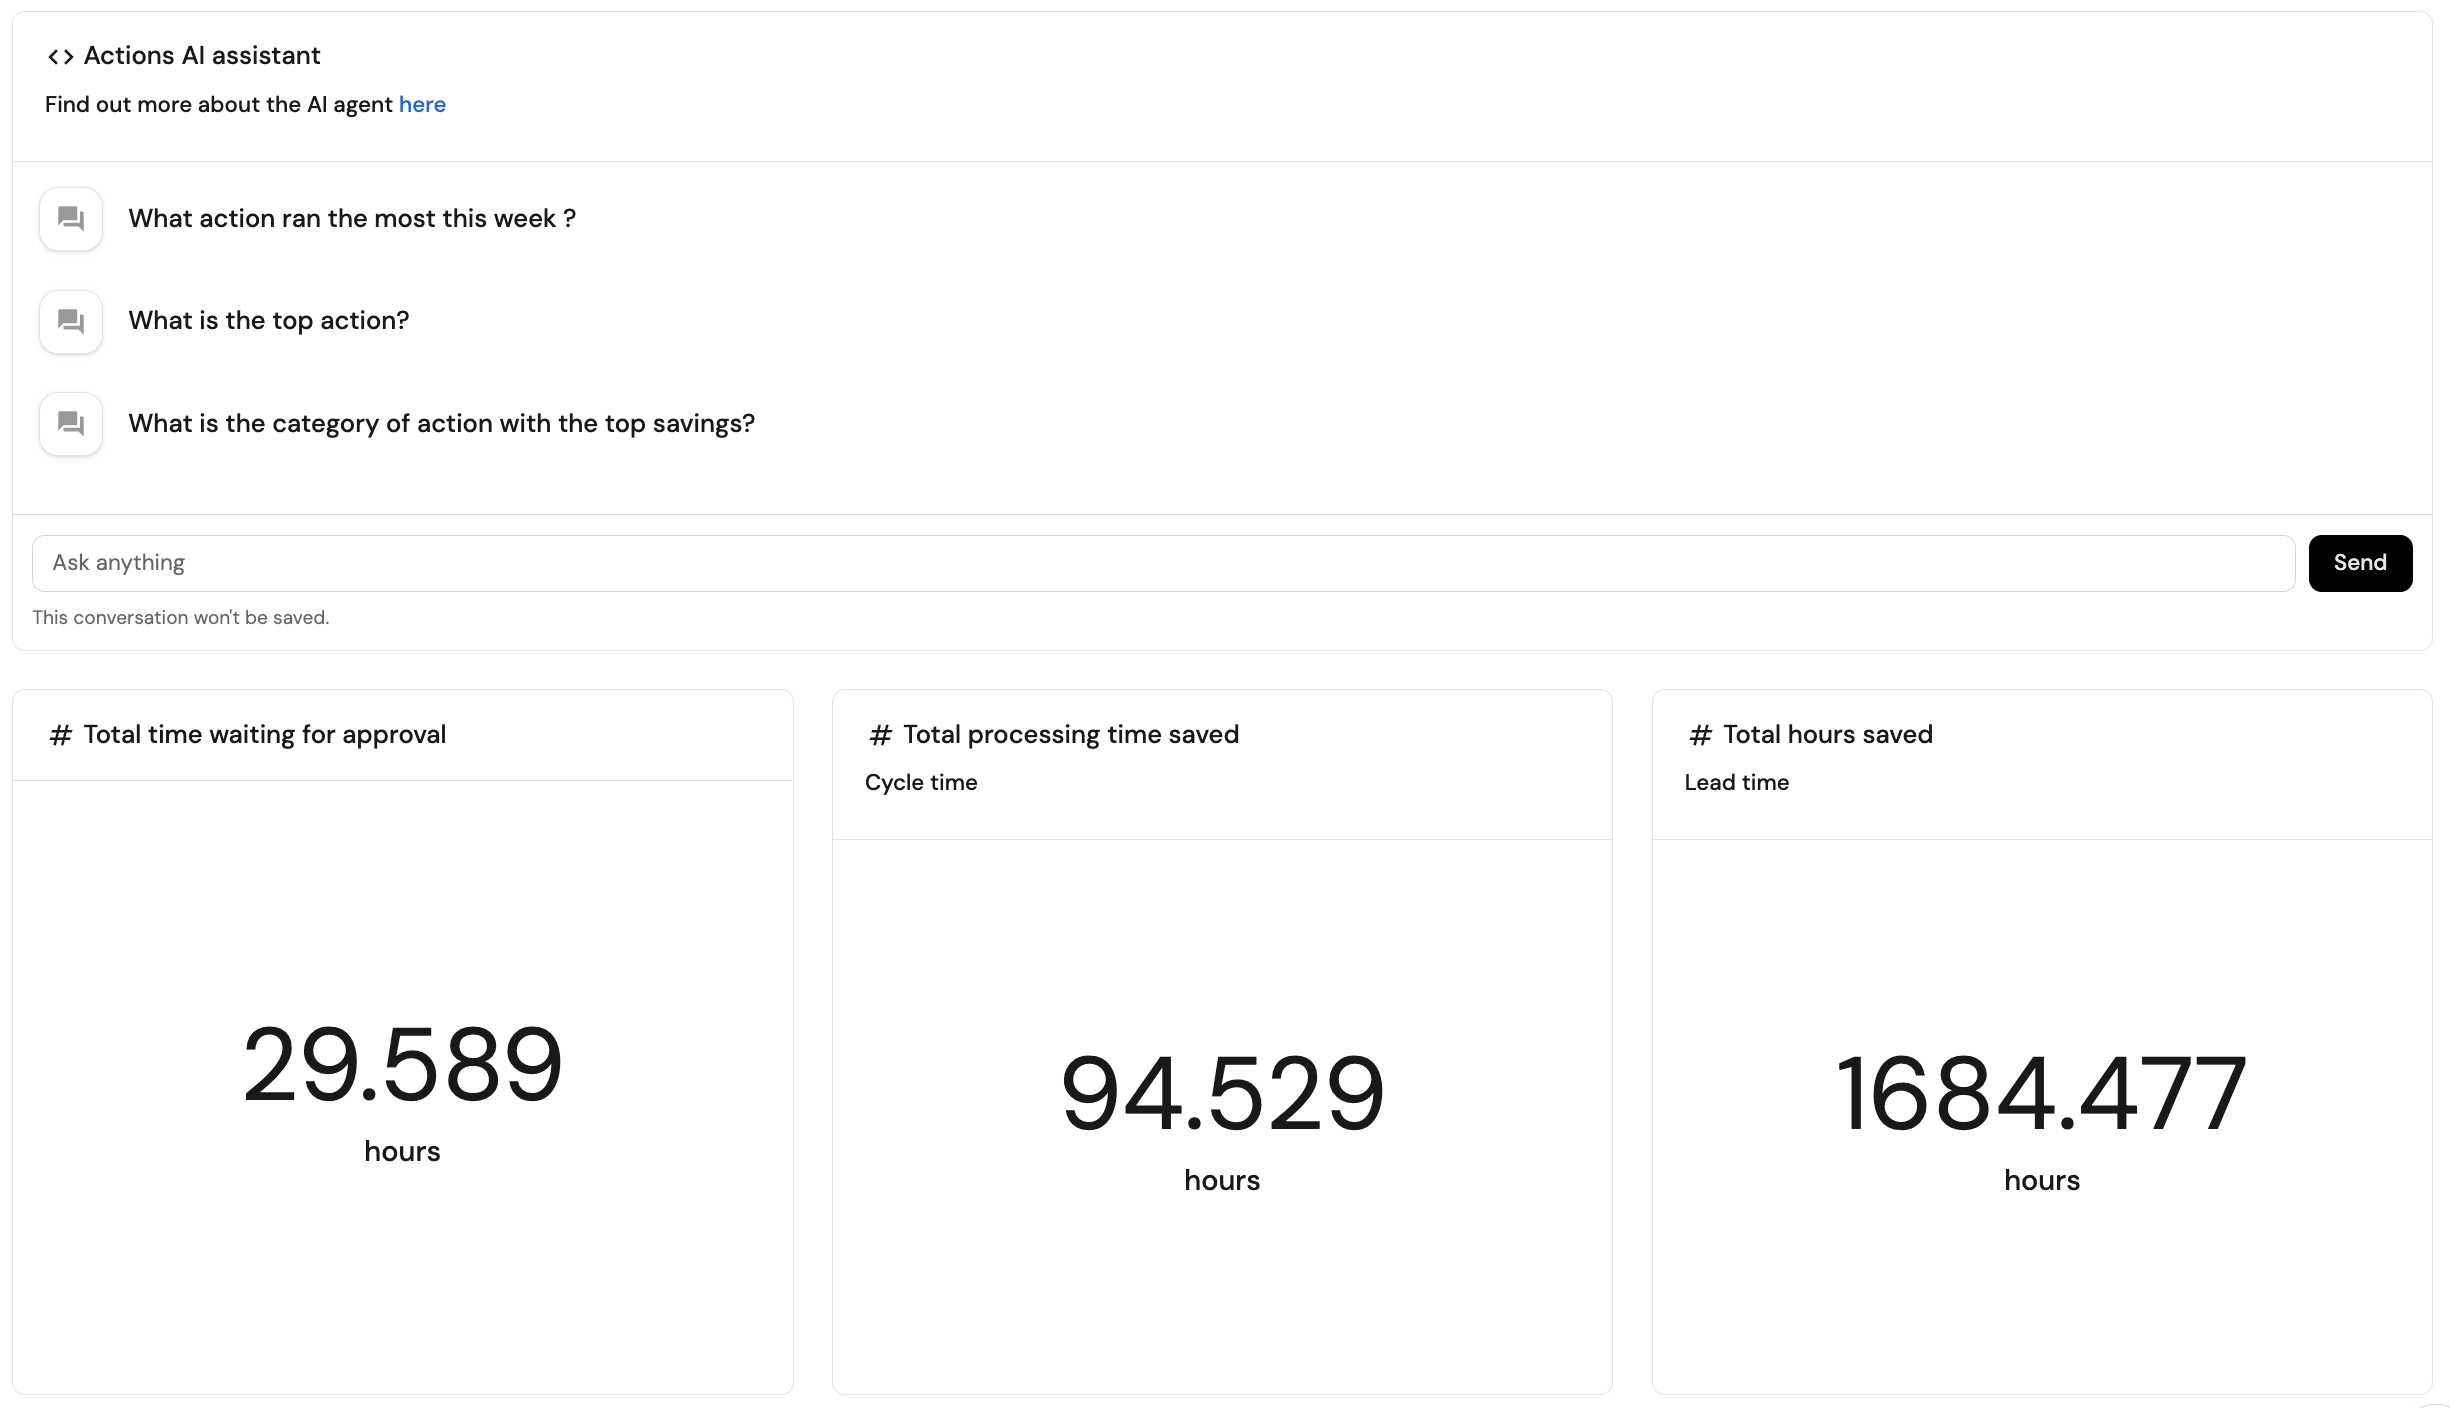
Example ROI dashboard based on Create ROI dashboard guide.
Follow the recommended guides below to implement this use case.