Track AI adoption
Why it matters
Engineering organizations are investing heavily in AI development tools like Copilot, Claude, Cursor but most can't answer basic ROI questions like how many licensed seats are actually being used? Is adoption correlated with productivity improvements? Which teams are getting value and which aren't? Without tracking, AI tooling budgets grow based on enthusiasm rather than evidence.
What to track
- Active usage rate: How many licensed seats are actively being used per team.
- Suggestion acceptance rate: What percentage of AI suggestions developers accept, by tool.
- Adoption distribution: Which teams are early adopters versus laggards.
- Productivity correlation: Whether higher AI adoption correlates with faster PR cycle times or higher deployment frequency.
- Developer sentiment: What developers actually think of these tools (combine with DevEx Surveys).
How Port helps
Port ingests usage data from Copilot, Claude, Cursor, and other AI tools and links it to the teams and services in your software catalog & context lake. This means you don't just see aggregate adoption numbers but you see adoption per team, correlated with that team's delivery metrics. Dashboards show whether teams with higher AI usage are actually delivering faster or more reliably.
Example scenario
An engineering VP approved 200 Copilot licenses six months ago and wants to know if the investment is paying off. Port's AI adoption dashboard shows that only 60% of licenses are actively used. Among active users, teams with high acceptance rates show 15% shorter PR cycle times compared to teams with low usage. The VP uses this data to run targeted enablement sessions for low-adoption teams rather than buying more licenses.
Example dashboard
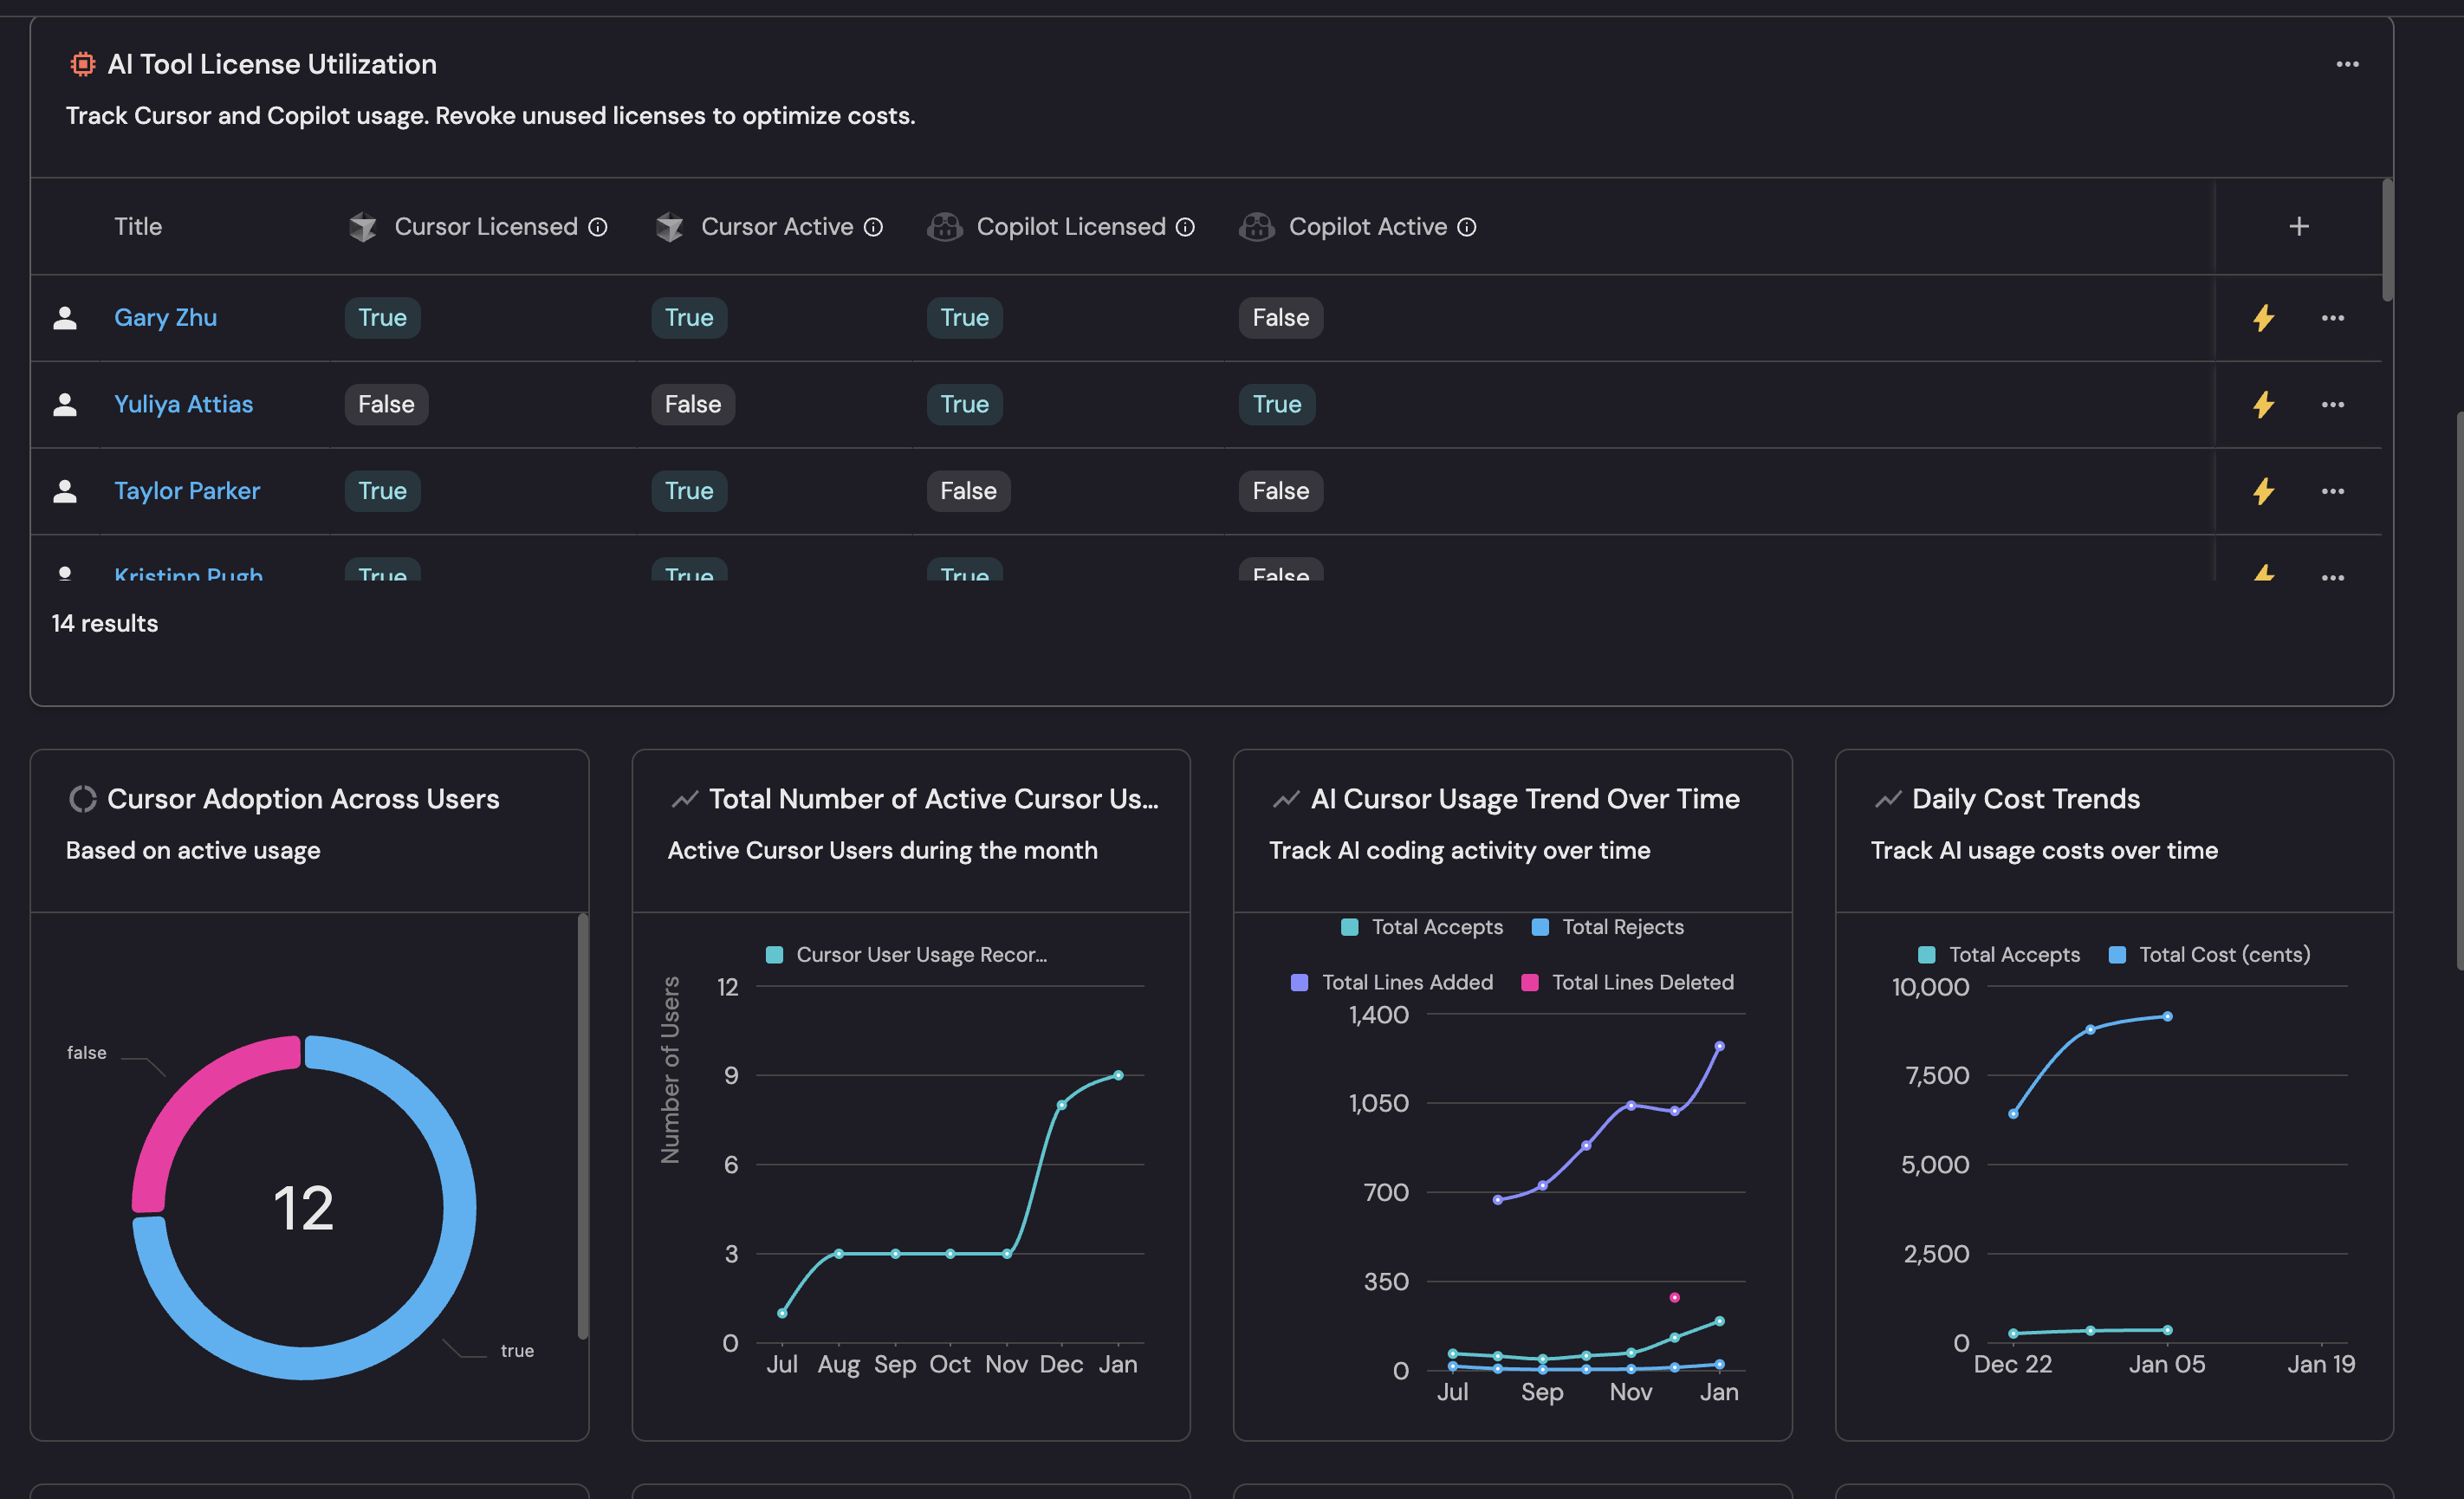
Example AI adoption dashboard based on Track AI adoption and impact guide.
Follow the recommended guides below to implement this use case.