Security metrics visualization
Port transforms security metrics from vanity numbers into actionable insights, helping CISOs, security teams, and developers align on what truly matters.
Executive summary
Port enables you to move beyond vanity metrics and create security dashboards that:
- Connect vulnerability data to business impact.
- Show trends, not just snapshots.
- Align executives, security teams, and developers around shared goals.
- Drive measurable, continuous improvement.
Most security dashboards today are filled with vanity metrics—impressive to look at, but meaningless for driving action.
Executives see:
- Raw vulnerability counts without business context.
- Generic compliance percentages.
- Inflated attack numbers from bots and scanners.
These metrics create false confidence and fail to answer the questions that truly matter:
- Are we getting more secure over time?
- Which areas deserve our immediate attention?
- How much business risk are we carrying today?
- Where should we invest resources for maximum impact?
Port solves this by enabling business-context-driven security metrics and flexible visualizations.
With Port, you can create dashboards that connect vulnerabilities, services, teams, and business risk—turning scattered technical data into strategic security intelligence.
Why traditional security metrics miss the mark
Traditional metrics focus on raw counts, not outcomes:
- “We have 15,847 vulnerabilities” – But which ones matter?
- “We’re 87% compliant” – Does that reduce actual risk?
- “We blocked 2.3 million attacks this month” – How many were real threats?
These metrics fail because they don’t provide:
- Context – Which services or customers are affected?
- Actionability – Who should fix the problem and by when?
- Business relevance – What’s the potential revenue or compliance impact?
Effective metrics answer questions, not just display numbers.
Align metrics with Port's business-context model
Using Port, you can design metrics that map to the same business-first approach as vulnerability prioritization.
Every metric can be tied to:
- Services → Criticality, environment, dependencies.
- Teams → Ownership, capacity, training adoption.
- Vulnerabilities → Severity, exploitability, business impact.
- Compliance scope → SOX, PCI, HIPAA, GDPR.
- Customer impact → Which customer tiers or SLAs are affected.
Every metric is sliceable by Services, Teams, Vulnerabilities, Compliance scopes, and Customer tiers, so prioritization follows business value, not just technical counts.
The dashboards snippets below make Port’s business-context model concrete:
- The compliance rings (ISO 27001, SOC 2, PCI, GDPR/HIPAA) tie metrics to scope, and can be filtered by service criticality and environment.
- Control Domain coverage plus control effectiveness/testing map to teams—who owns what, where capacity is spent, and how well practices are adopted.
- The incident metrics (priority mix, timeline completeness/management, MTTR, escalations) connect vulnerabilities to customer impact
- Severity drives priority, MTTR expresses SLA risk by tier, and escalations expose leadership-level exposure.
This alignment ensures metrics and dashboards are directly actionable, not just observational.
CISO dashboards with metrics that matter
- Security leaders need dashboards that tell a story about progress and risk.
- Port enables this with flexible visualizations, linking data sources to executive-friendly KPIs.
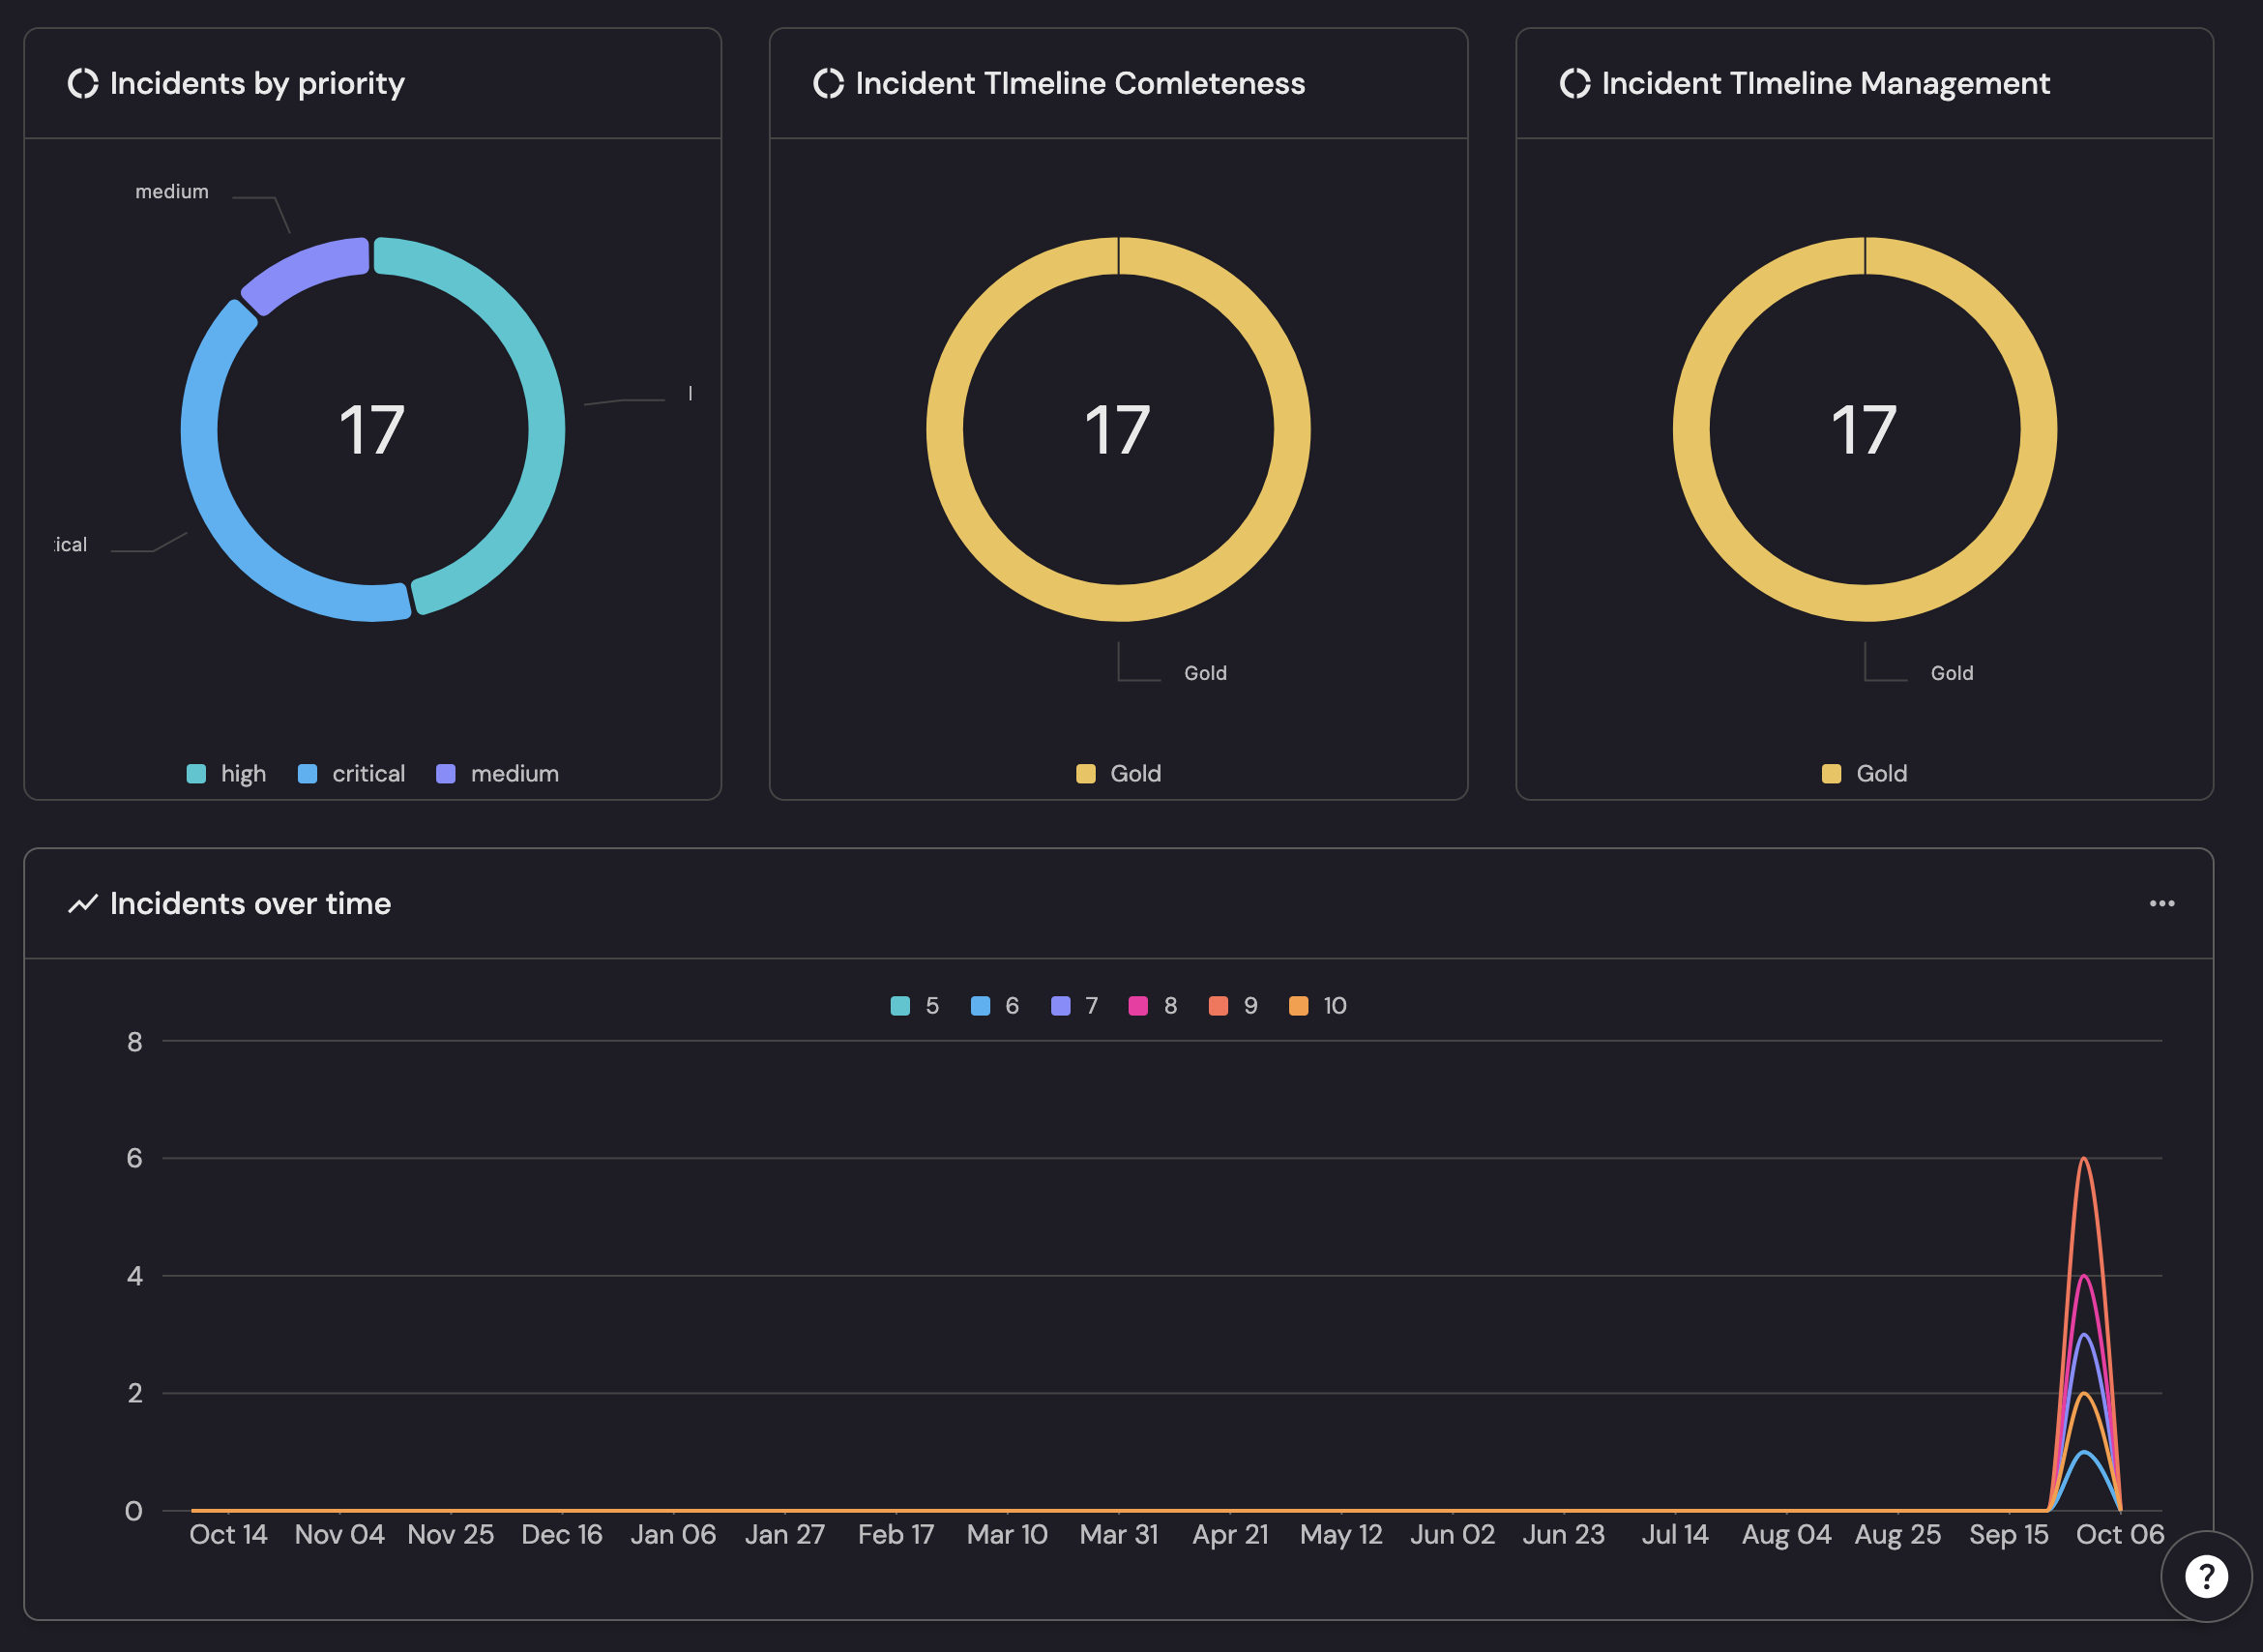
The below snippet from port dashboard is a CISO-at-a-glance view: exposure, discipline, and trajectory.
- Exposure: Incidents by priority shows the mix (17 total across critical/high/medium) so you know risk, not just count.
- Discipline: Incident Timeline Completeness and Timeline Management are Gold for all 17—clean comms, postmortems, and SLA hygiene.
- Trajectory: Incidents over time highlights the early-October spike to spot surges and capacity pinch points.
Together, these tie outcomes to action—where risk sits, how well response runs, and whether things are trending up or down—so funding and focus land where they matter.
1. Business risk metrics
These metrics focus on business impact, not just technical severity:
| Metric | Why It Matters | Example Port Implementation |
|---|---|---|
| Critical service exposure | Identify high-risk production services with exploitable vulnerabilities | Dashboard showing open critical vulnerabilities by production service blueprint |
| Mean time to remediation (MTTR) by criticality | Measure how quickly issues are fixed where it matters most | SLA tracking dashboards connected to Jira via Port automations |
| Risk-adjusted vulnerability trends | Track whether overall risk is increasing or decreasing | Line chart showing risk score trends over time by service criticality |
| Compliance gap analysis | Understand gaps that affect revenue or compliance requirements | Scorecard tracking services mapped to regulatory frameworks |
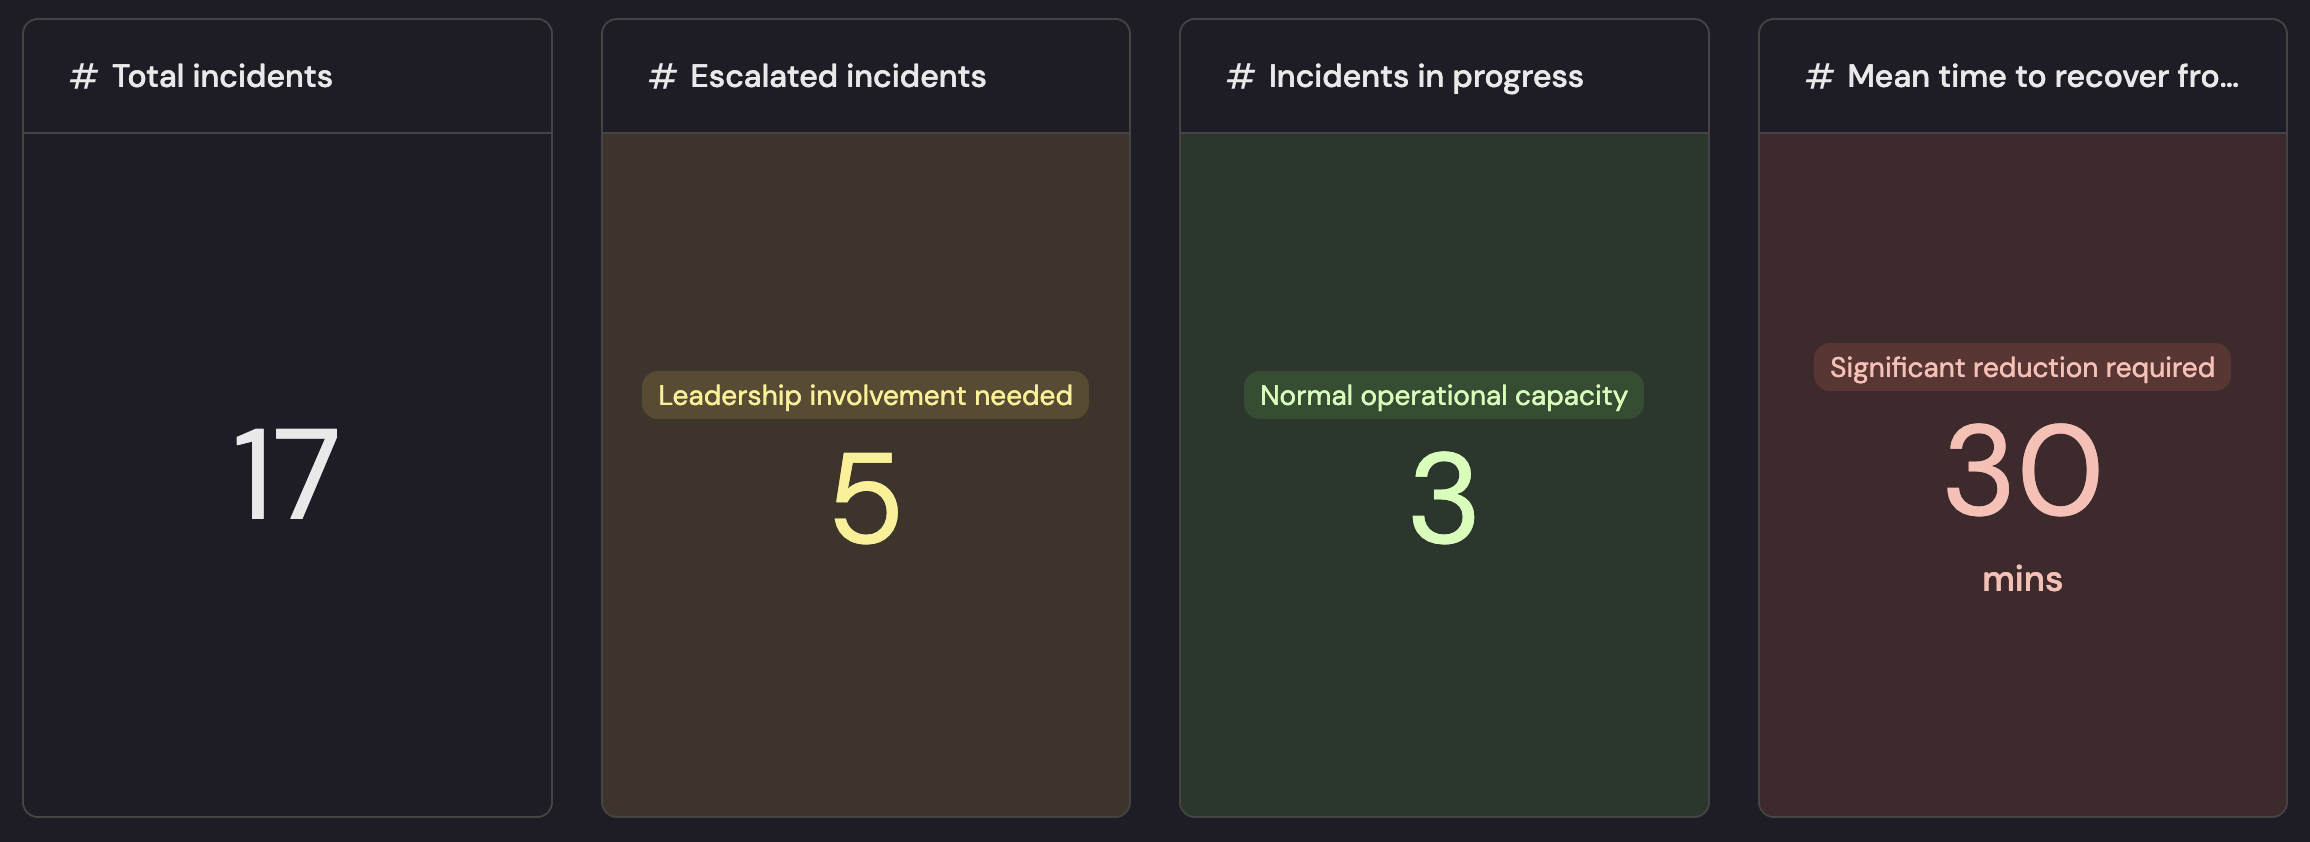
The dashboard views below express Business risk, distilled:
- 17 incidents total.
- 5 escalated to leadership.
- 3 in progress within normal capacity.
- MTTR: 30 minutes, the main lever to cut customer impact.
- Assurance shows 7 audits completed, 15 evidences collected, and 5 pending review.
- The audit gap assessment (7 items) flags remaining weaknesses.
Together, these metrics reveal where risk concentrates (escalations and gaps), how severe it is (MTTR), and how prepared you are (audit/evidence flow) so spend targets the highest exposure.
2. Security Culture and Adoption Metrics
Security is a cultural challenge as much as a technical one:
| Metric | Purpose | Example Port Feature |
|---|---|---|
| Security training completion rates by role | Track developer readiness | Service owner metadata + scorecards |
| Scorecard adoption | Gauge how many teams actively improve posture | Scorecard completion tracking across teams |
| Time to complete security reviews | Measure SDLC integration of security | Relations between services and review actions |
| Security champion engagement | Monitor champion program health | Blueprint for champions tied to team entities |
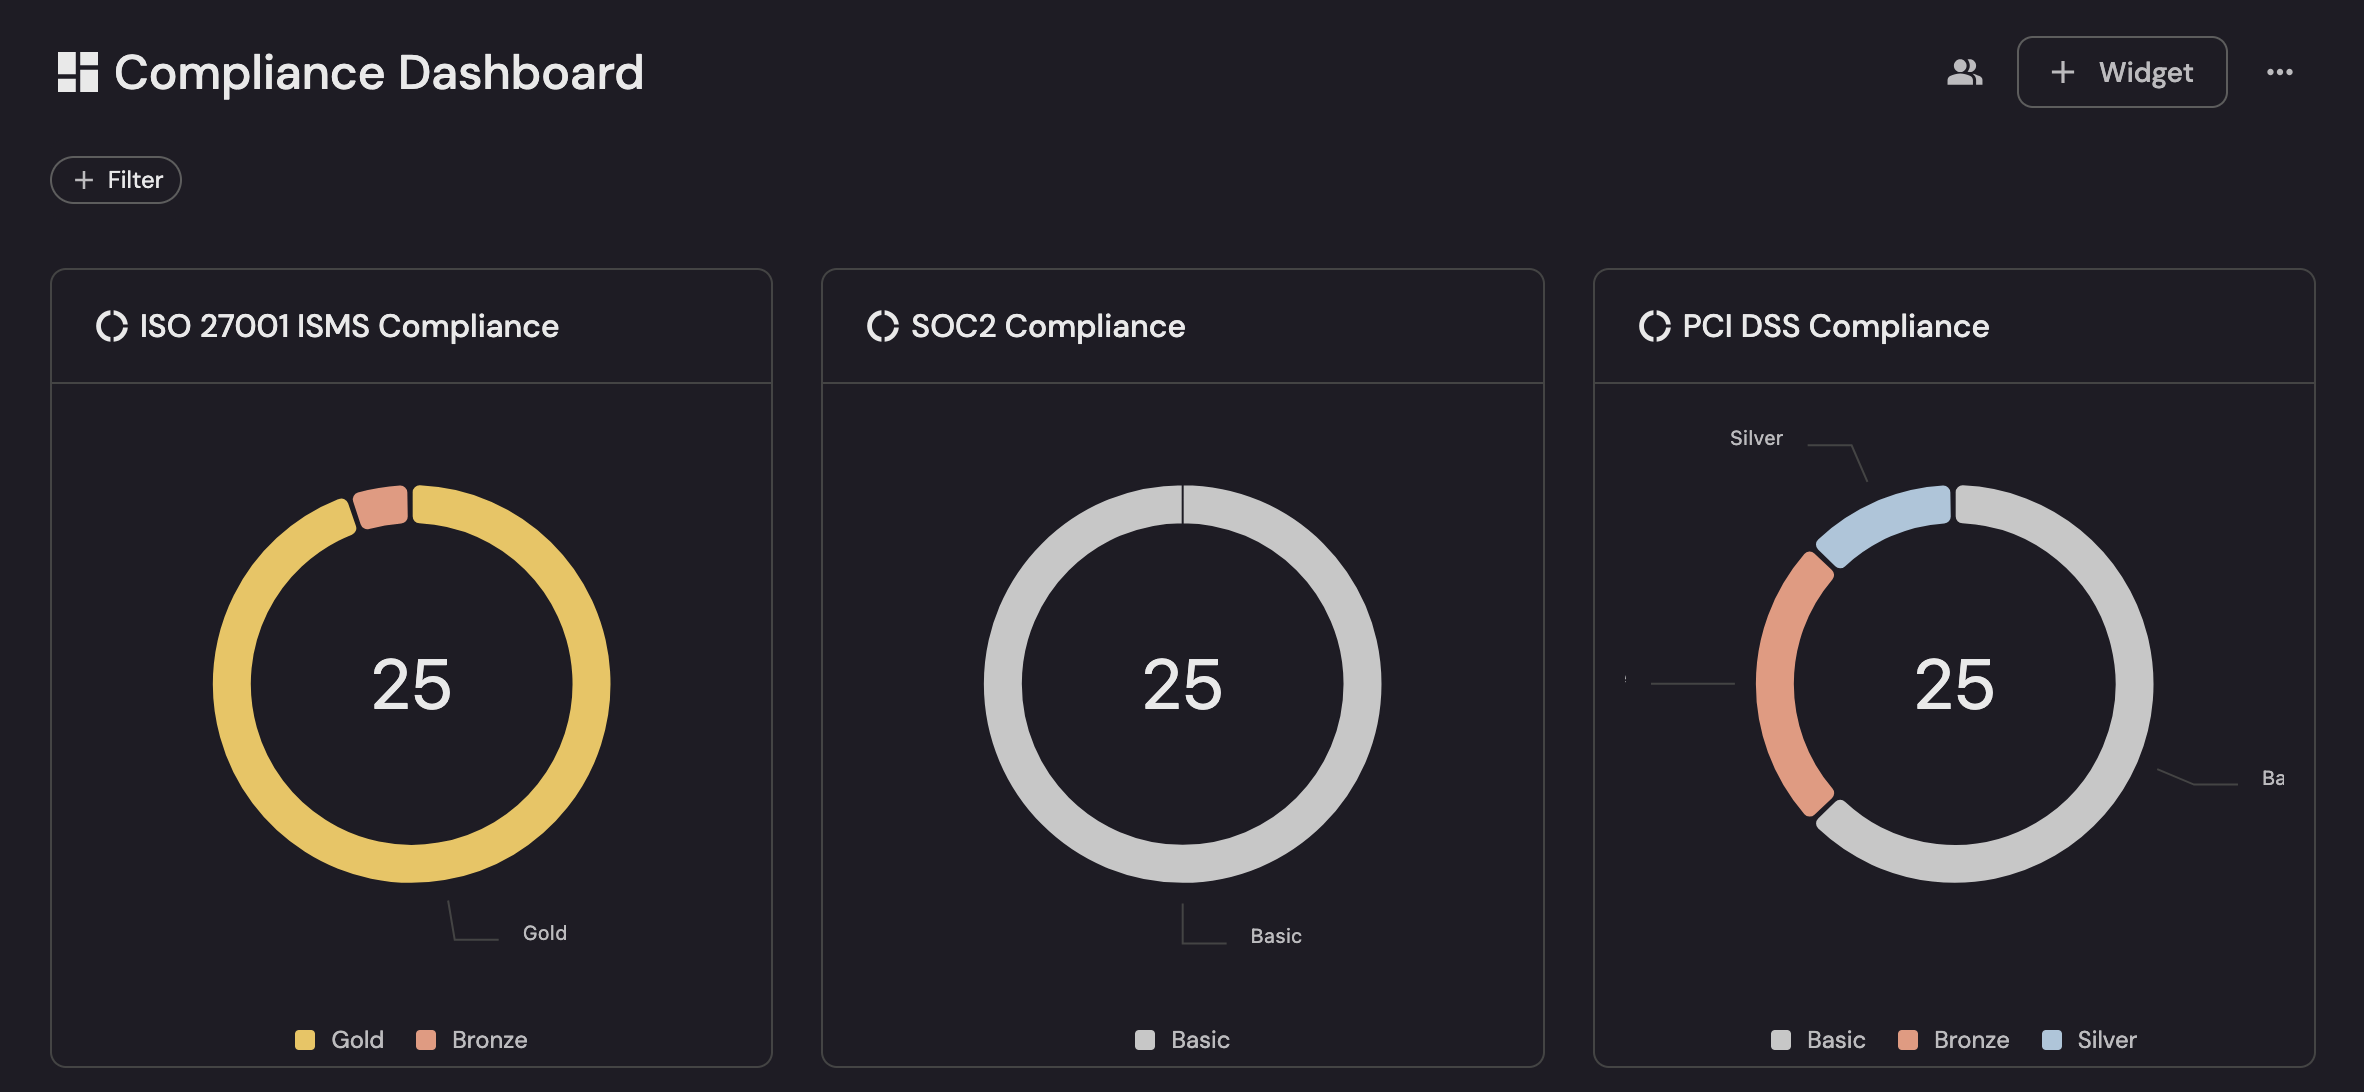
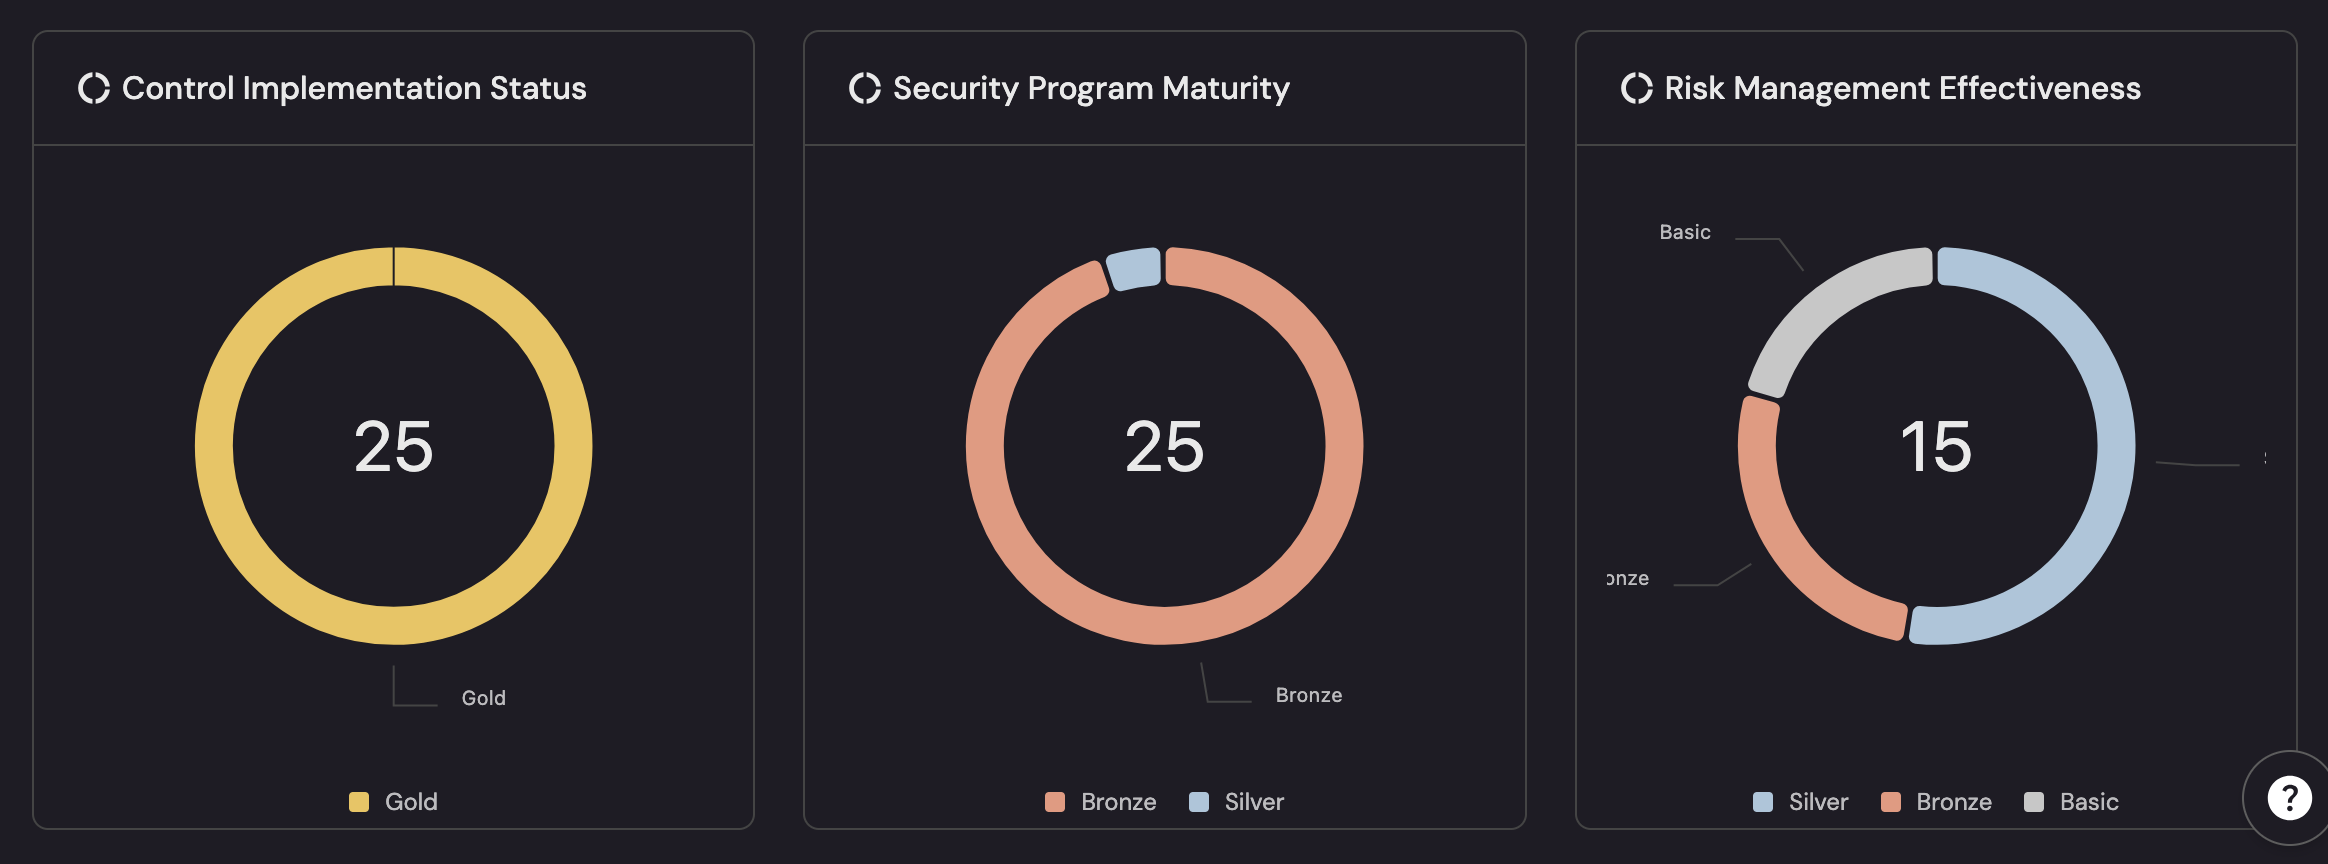
The below dashboard snippet shows security culture and adoption in three beats:
- Control Implementation Status (25, Gold) shows broad buy-in—controls are deployed and owned across the org.
- Security Program Maturity (25, mostly Bronze with some Silver) signals teams are adopting standards but depth and repeatability are still maturing.
- Risk Management Effectiveness (15, mixed tiers) reflects how consistently people use the process day-to-day—many basics are followed, some groups performing at Silver, with pockets to lift. Net adoption is wide, culture is forming, and the next move is raising consistency from Bronze/Basic to Silver/Gold.
3. Operational efficiency metrics
Showcase security team performance and tool effectiveness:
| Metric | Purpose | Port Implementation |
|---|---|---|
| Alert triage efficiency | Measure wasted effort on non-actionable alerts | Dashboard of alerts → resolved vs ignored |
| False positive rates by tool | Identify underperforming tools | Table comparing scanner findings vs verified issues |
| Incident detection & response time | Track how quickly incidents are resolved | SLA tracking via actions + incident blueprint |
| Automated remediation success rates | Prove automation ROI | Trend chart of automation success vs manual fixes |
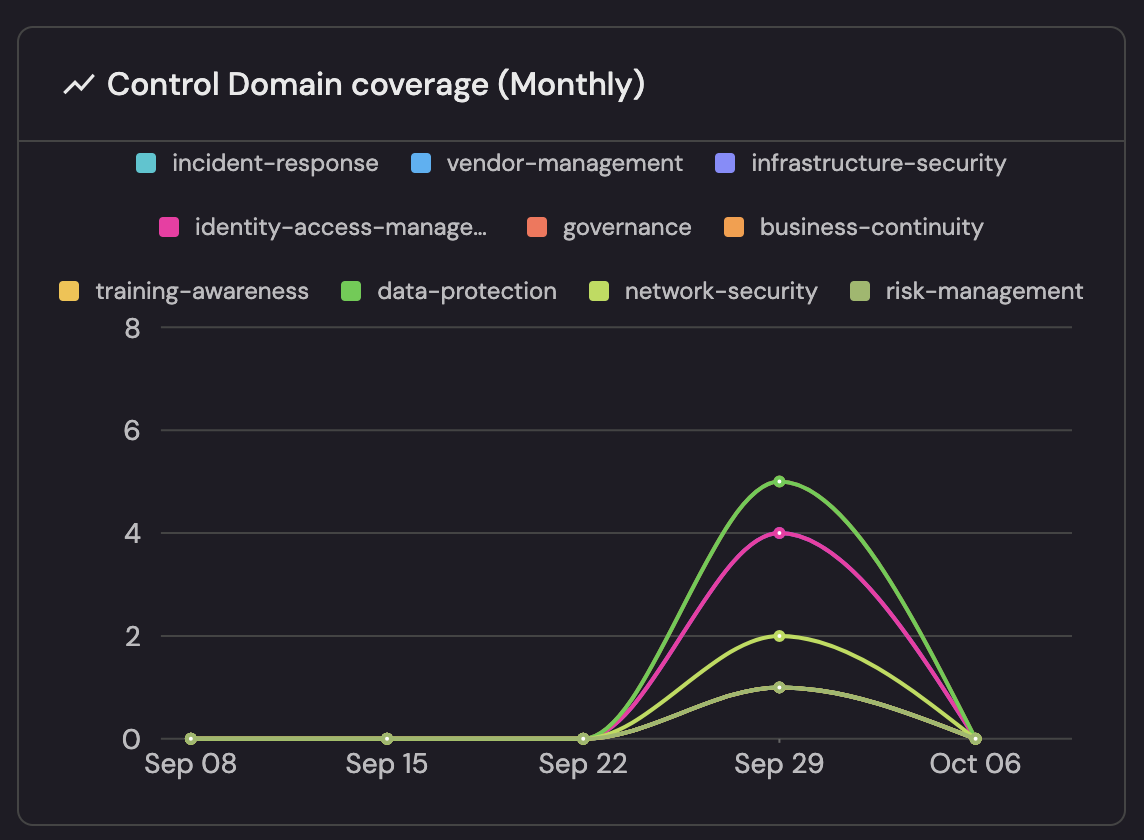
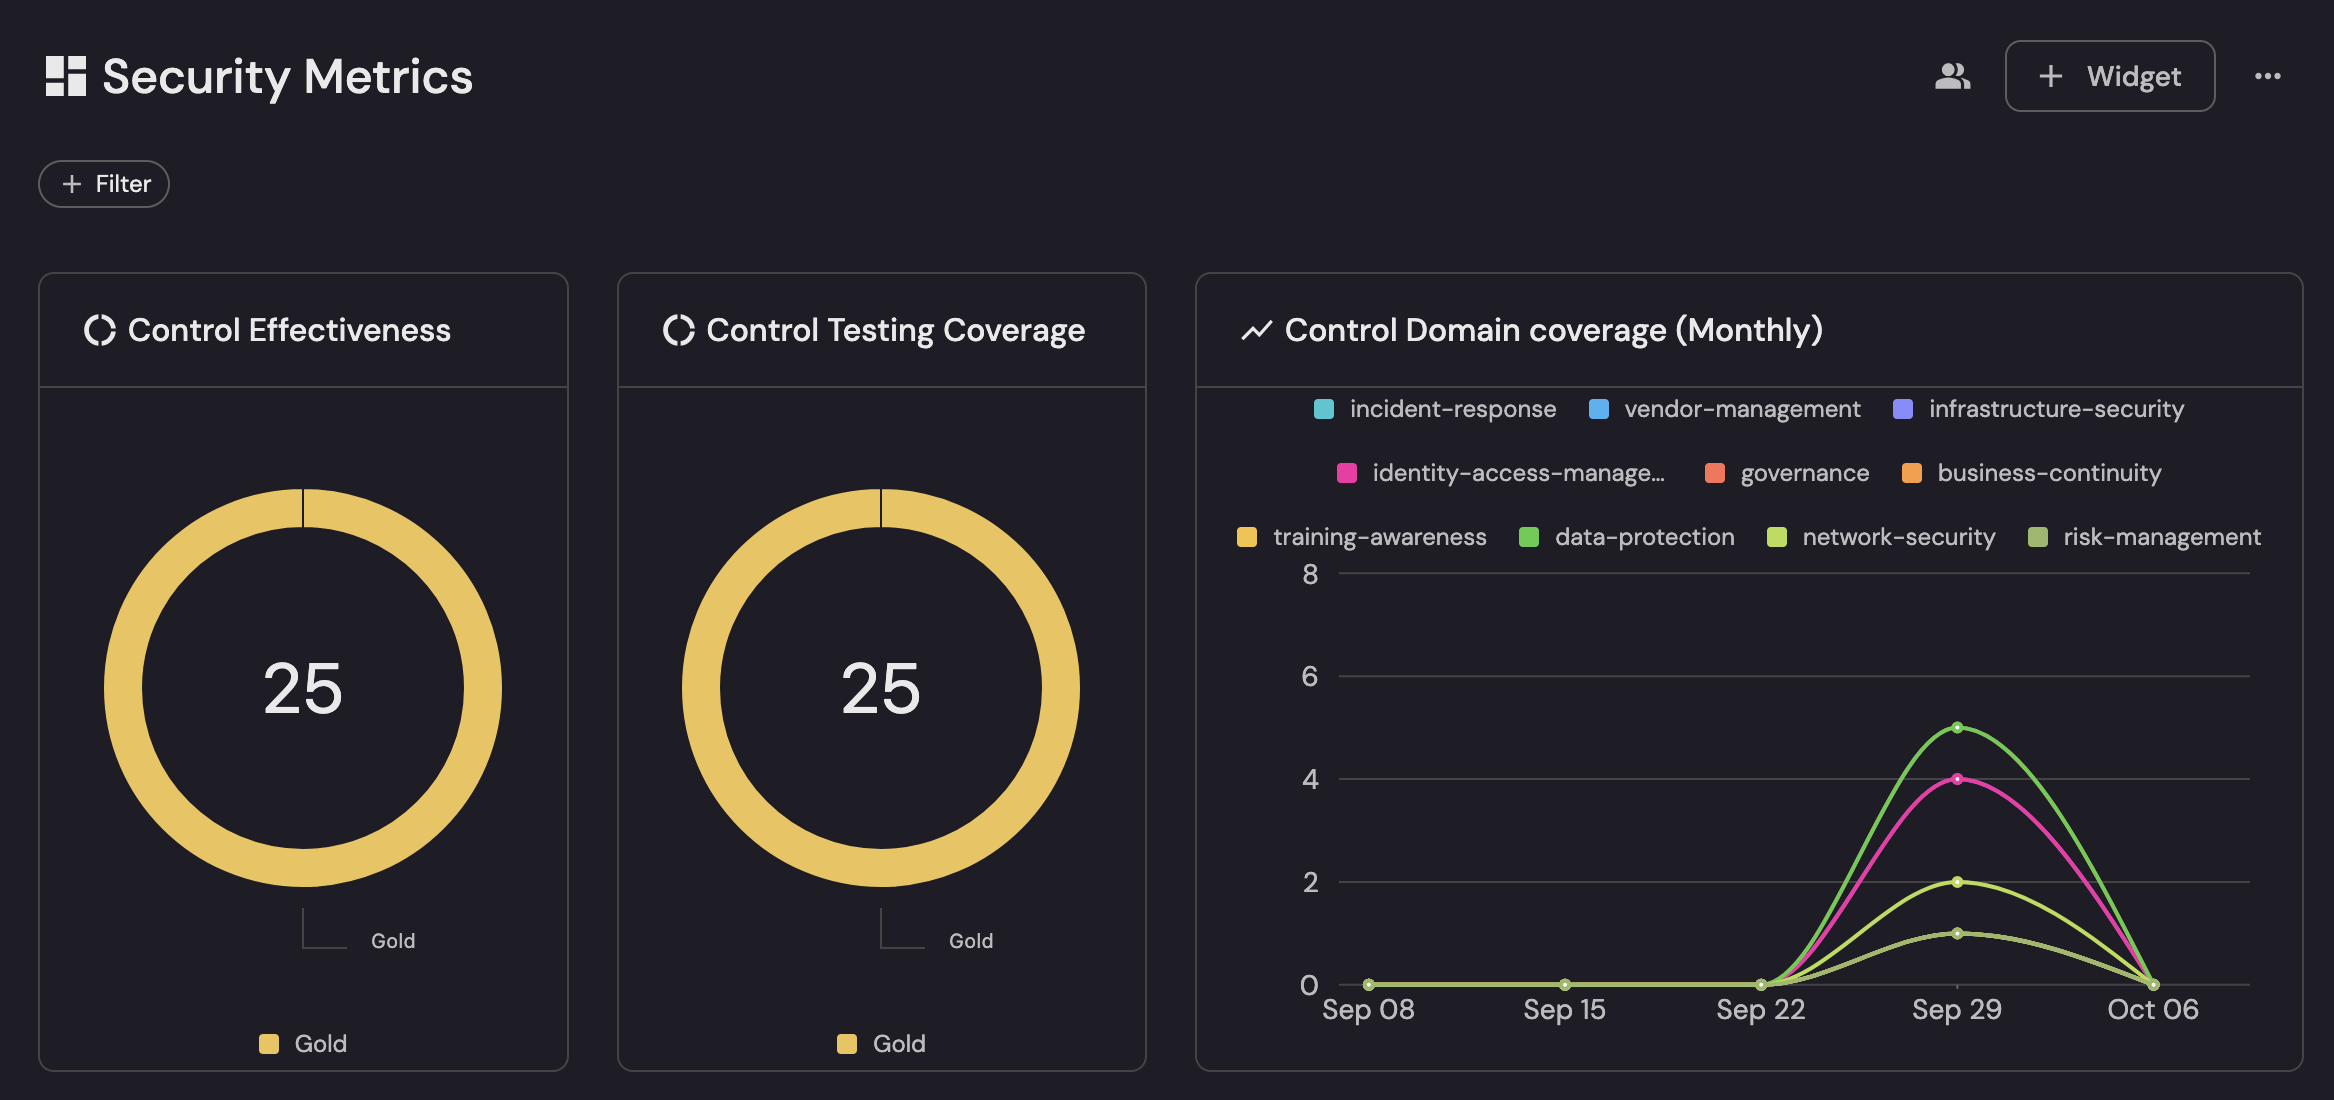
The below view captures operational efficiency by showing how well and how consistently your program runs: Control Effectiveness and Control Testing Coverage both at 25 (Gold) signal that all 25 controls meet a high maturity bar and are being validated on schedule, minimizing rework and audit risk. The Control Domain coverage (Monthly) trend then shows execution throughput by domain—e.g., late-September surges in network security, data protection, and IAM—making it easy to spot where effort is concentrated, where capacity may be over/under-allocated, and how evenly the team is maintaining control coverage over time.
Single-point metrics can mislead.
Port dashboards allow you to visualize trends over time, showing whether posture is improving, stable, or declining.
Adding context to every metric
Metrics are only meaningful when paired with context.
Port makes this simple by linking metrics to entities, relationships, and properties in your software catalog.
1. Benchmarking and comparisons
- Industry benchmarks – Compare your performance to peers.
- Historical trends – Track improvements over time.
- Peer comparisons – Compare different teams or business units.
- Goal tracking – Map progress against organizational targets.
2. Business impact context
- Revenue at risk – Link vulnerabilities to customer-facing services.
- Customer impact – Show which customer tiers are affected.
- Regulatory exposure – Highlight compliance-sensitive services.
- Cost to fix – Estimate resource needs for remediation.
3. Actionability indicators
- Clear ownership – Port automatically routes issues to the right team.
- Remediation timelines – Track SLA adherence at the service level.
- Resource dependencies – Understand what’s needed to close gaps.
- Success criteria – Define thresholds for “secure enough” states.
Port dashboards for different audiences
Port dashboards can be tailored for multiple audiences, each consuming the same core data differently.
Executive dashboards
High-level view of business risk and compliance:
- Visualize Wiz vulnerabilities with service context.
- Track AWS storage configurations.
- Monitor GitHub IAM and repository security.
Operational dashboards
Detailed views for security teams managing workflows:
- GitHub Dependabot alerts with triage status.
- SLA tracking dashboards tied to vulnerability blueprints.
- False positive rate tracking per tool.
Team-specific dashboards
Helping development teams understand their own posture:
- Scorecards for compliance and secure development practices.
- Training completion metrics linked to team entities.
- Vulnerability introduction vs remediation trends by repo.
Building a security metrics program with Port
Phase 1: establish baseline metrics
Start with metrics every organization needs:
- Open critical vulnerabilities by production service.
- MTTR by severity and service criticality.
- Security training completion rates.
- Mean time to detect/respond to incidents.
Phase 2: add business context
Enrich metrics with Port relationships and properties:
- Link vulnerabilities to revenue impact and compliance frameworks.
- Scorecards showing secure-by-default service adoption.
- Dashboards tracking culture metrics alongside risk metrics.
Phase 3: predict and prevent
Move toward predictive capabilities:
- Forecast vulnerability trends based on recent changes.
- Identify services at risk of future compliance gaps.
- Automated alerts when risk scores exceed defined thresholds.
Success indicators for your metrics program
You’ll know your program is working when:
- Executives ask informed questions about risk, not raw counts.
- Security teams spend less time generating reports and more time improving posture.
- Developers proactively fix vulnerabilities without security hand-holding.
- Boards can measure ROI on security investments with shared dashboards.
Alignment with vulnerability prioritization
This metrics program directly complements the vulnerability prioritization approach:
- Metrics are built from the same entities and relationships used to prioritize vulnerabilities.
- Scorecards track progress over time, showing if prioritization efforts are working.
- Dashboards bridge strategic and operational views, using the same data pipelines.
By connecting metrics and prioritization in one platform, Port eliminates silos and provides a single source of truth for security performance.
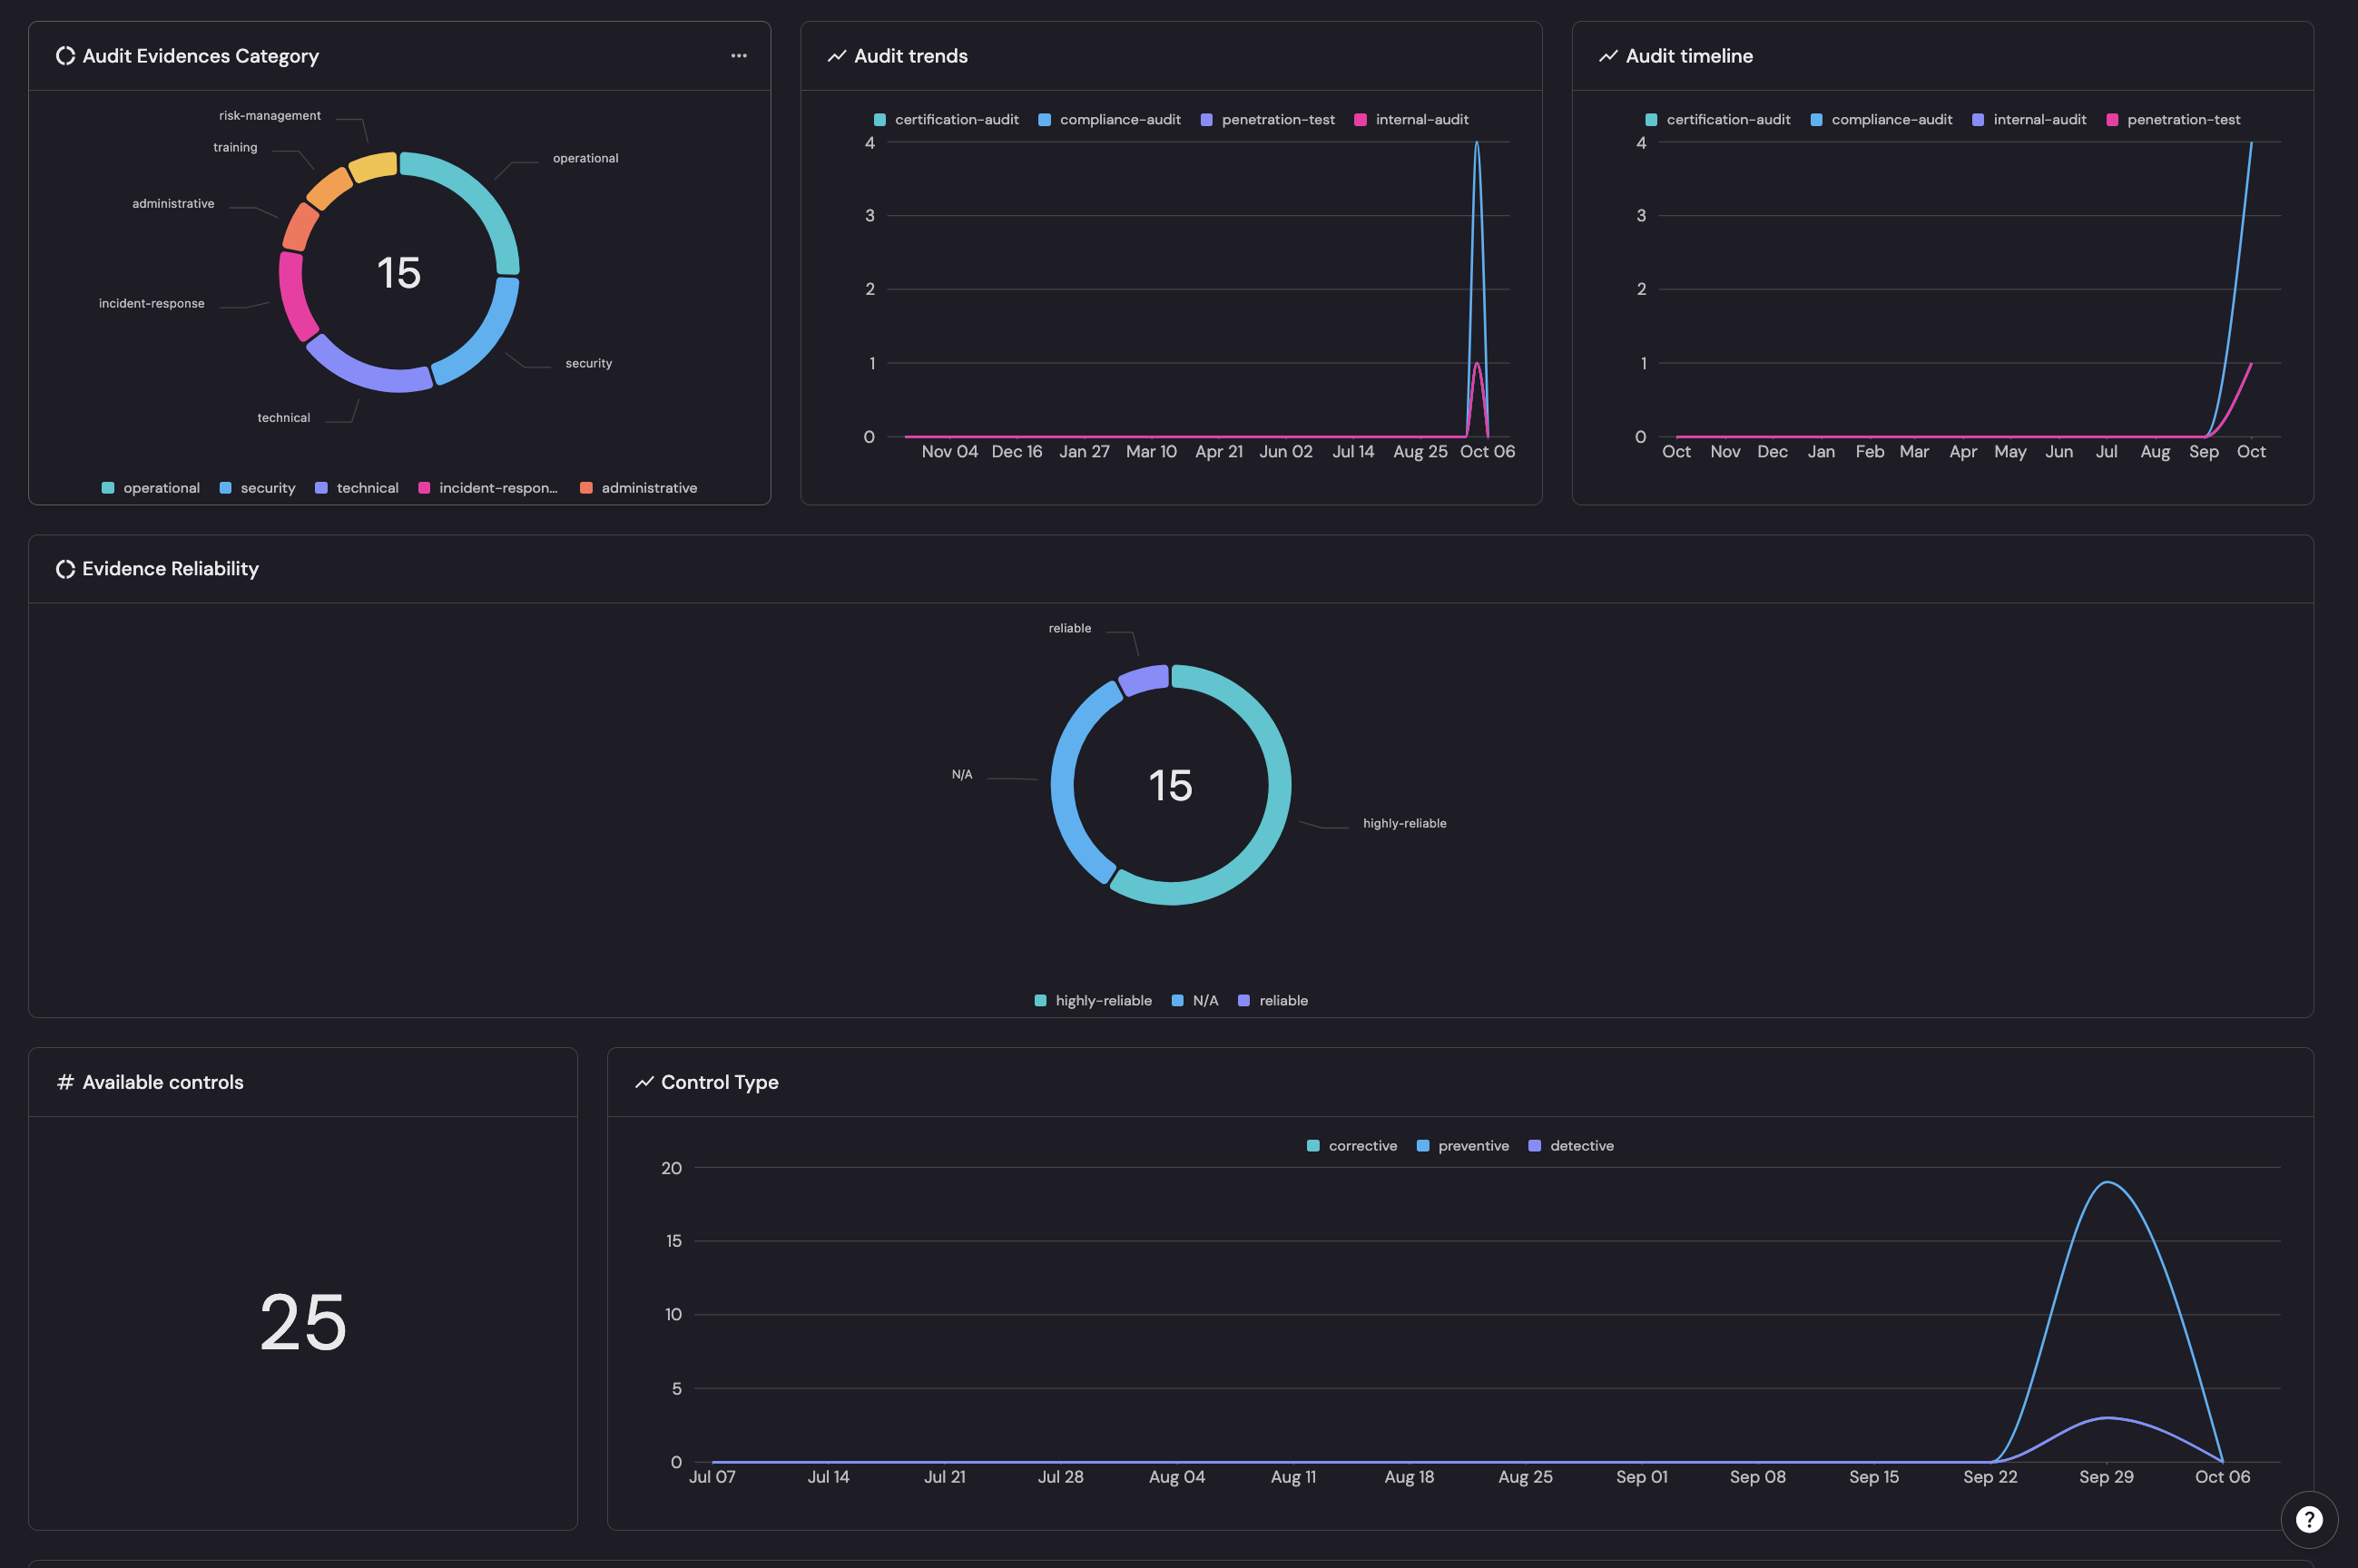
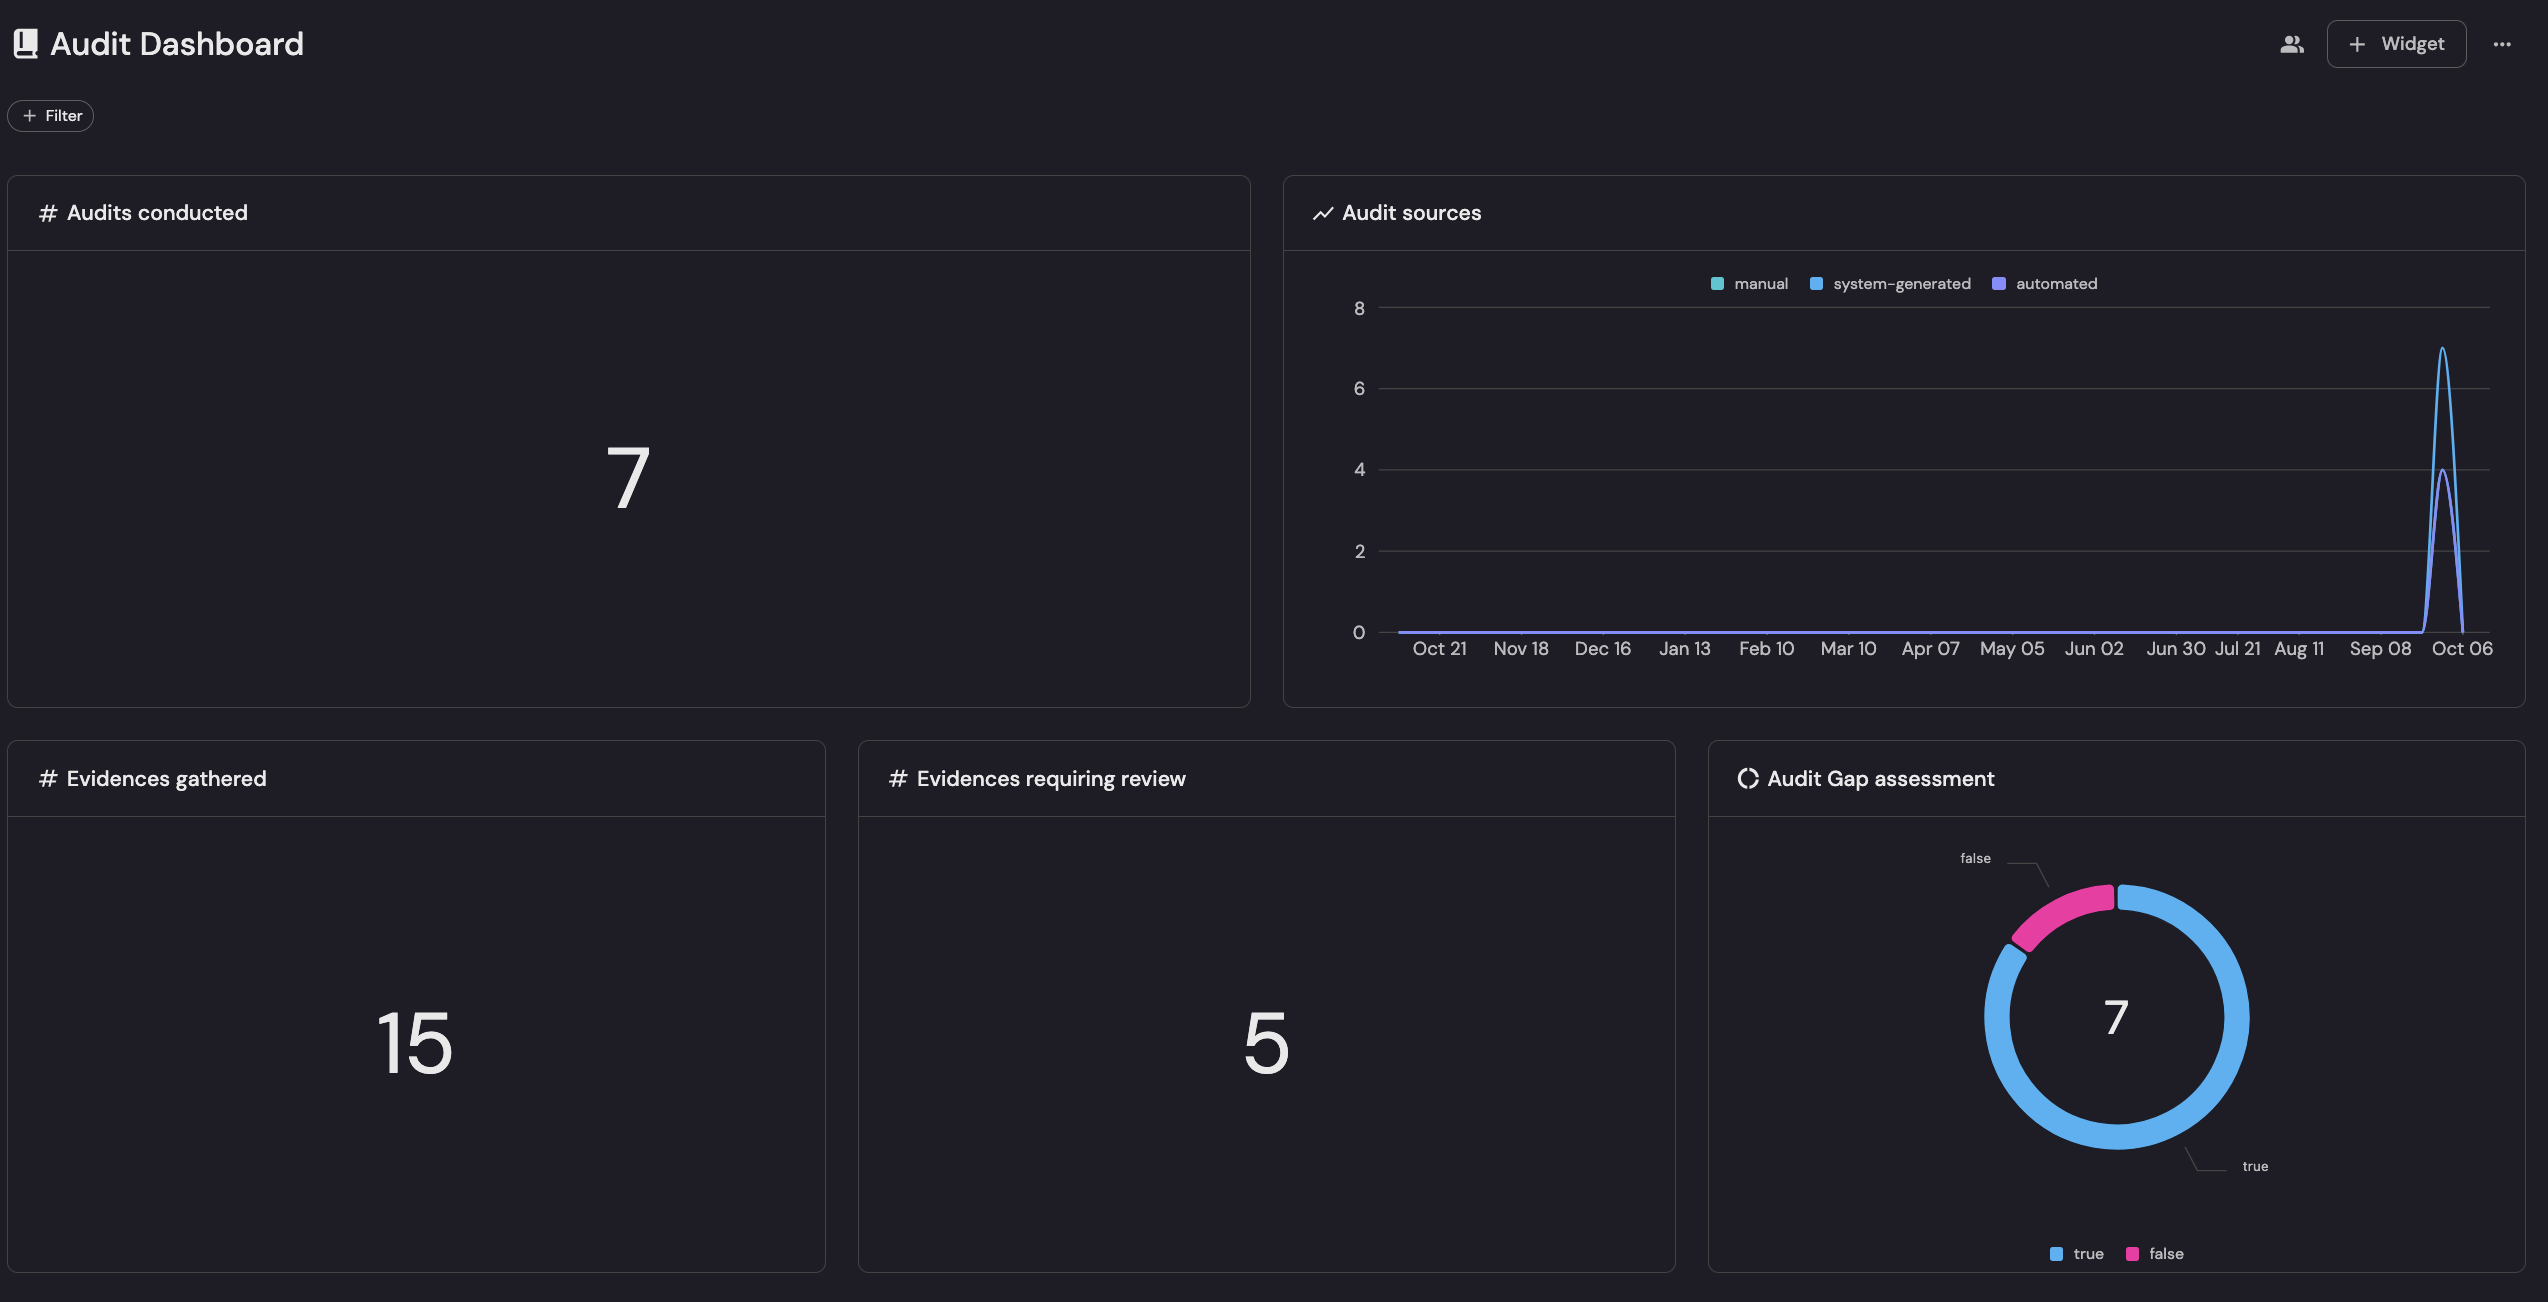
Port's dashboard snippet below supports risk-based vulnerability prioritization by showing what matters, how sure we are, and how soon it’s due:
- The evidence Category groups 15 findings by business domain (operational, security, technical, etc.) to gauge impact.
- Evidence Reliability weights each item by confidence (highly-reliable > reliable > N/A) to cut noise.
- Audit trends/timeline surface time-pressure from pen-test and certification spikes
- Available controls/Control Type reveal coverage gaps (e.g., thin detective/corrective controls) that raise residual risk.
In practice, vulnerability catalog items can be ranked with a compact rubric — Priority = Business Impact × Evidence Reliability × Audit Urgency × Control Gap. For instance, highly-reliable security/technical pen-test findings during the October surge with weak non-preventive control coverage move to the top.